
Maximizing Profits with AI Trading Signals
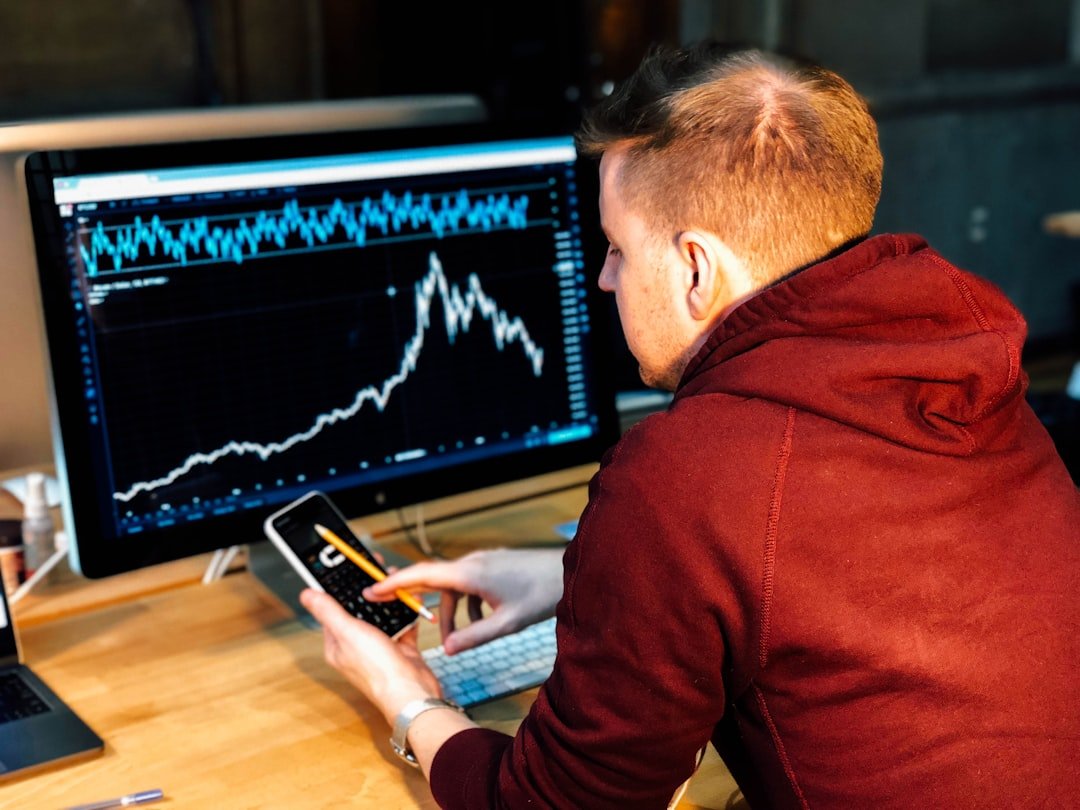
In the rapidly evolving landscape of financial markets, the integration of artificial intelligence (AI) has revolutionized trading strategies and decision-making processes. AI trading signals are a product of this technological advancement, providing traders with data-driven insights that can significantly enhance their trading performance. These signals are generated through complex algorithms that analyze vast amounts of […]
Maximize Profits with Buy NIFTY Strategy
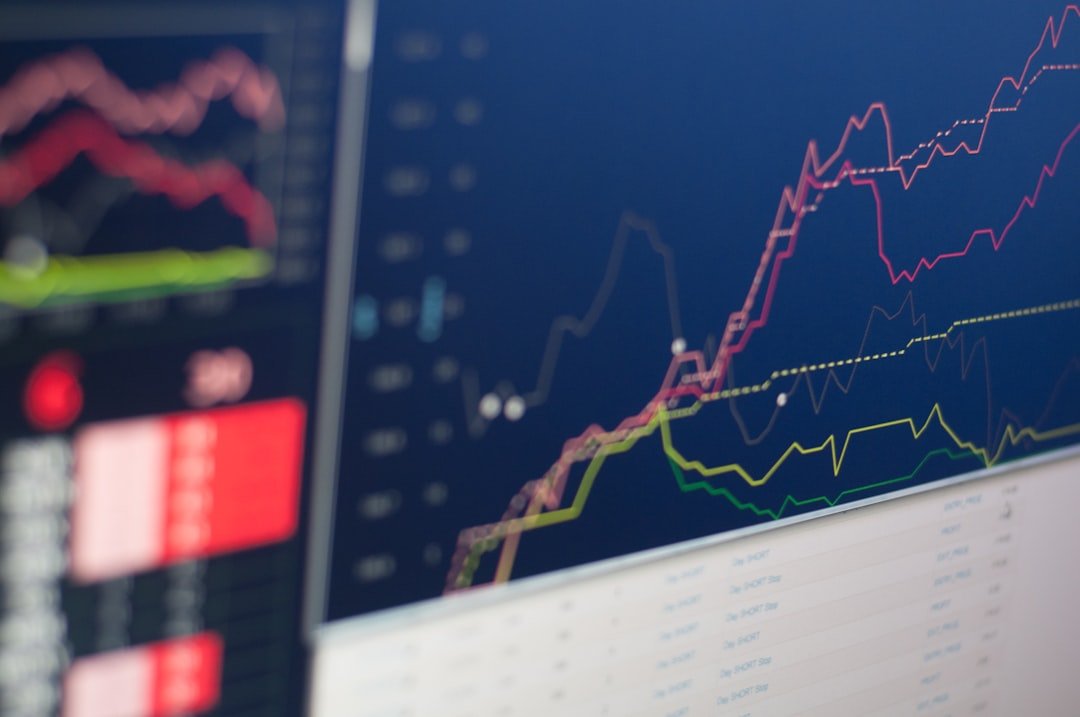
The Buy NIFTY strategy is a popular trading approach in the Indian stock market, particularly among retail investors and traders. It revolves around purchasing NIFTY 50 index futures or exchange-traded funds (ETFs) that track the NIFTY 50 index, which comprises the top 50 companies listed on the National Stock Exchange (NSE) of India. This strategy […]
Maximize Profits with Renko Trend Bot
The Renko Trend Bot is a sophisticated trading tool designed to enhance the trading experience by utilizing Renko charts, which are unique in their construction. Unlike traditional candlestick or bar charts that represent price movements over time, Renko charts focus solely on price changes, filtering out the noise of time and volume. This characteristic allows […]
Automate Your Trading with SuperTrend Auto Bot
In the rapidly evolving landscape of financial trading, automation has emerged as a game-changer, allowing traders to execute strategies with precision and speed. Among the myriad of trading tools available, the SuperTrend Auto Bot stands out as a sophisticated solution designed to enhance trading efficiency. This automated trading system leverages the SuperTrend indicator, a popular […]
Maximize Profits with Crypto Trend Bot

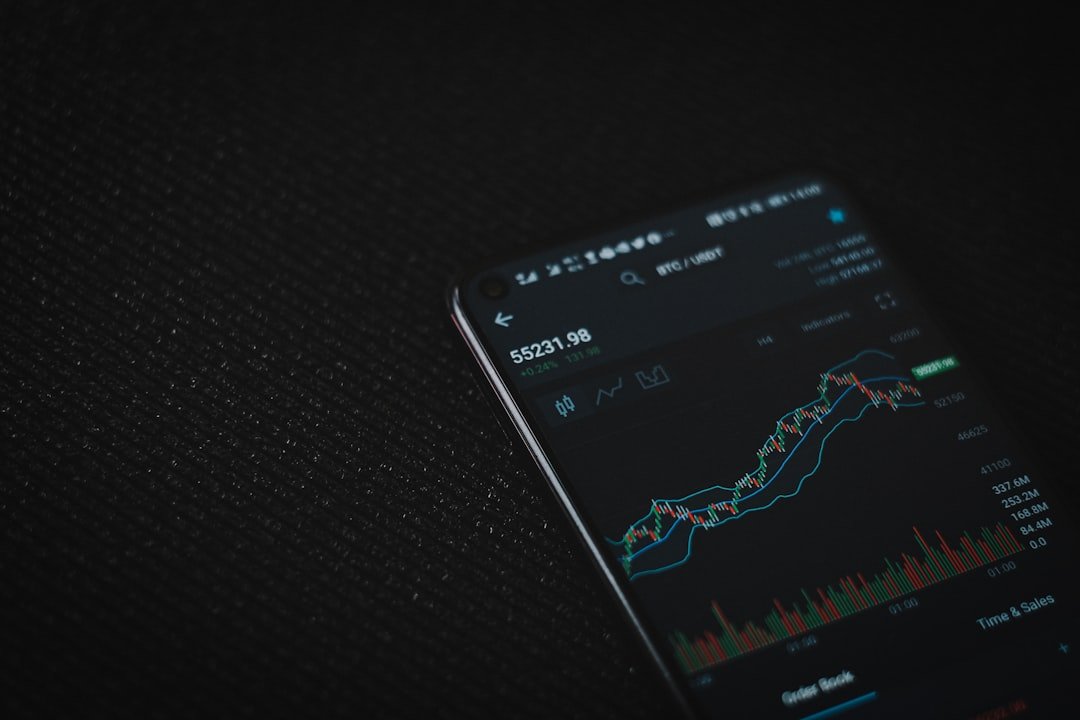
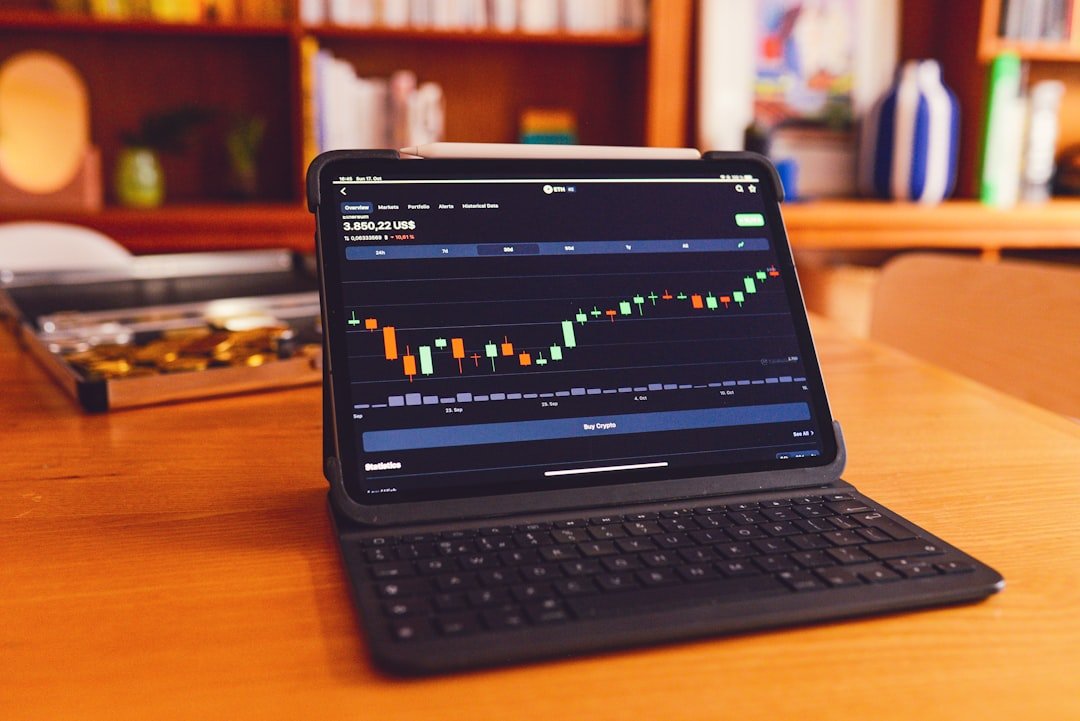
A crypto trend bot is an automated trading system designed to analyze market trends and execute trades based on predefined criteria. These bots utilize algorithms to identify patterns in price movements, allowing traders to capitalize on market fluctuations without the need for constant manual intervention. The primary objective of a crypto trend bot is to […]
Automating Gold Trading with a Bot

Gold trading has long been a cornerstone of financial markets, serving as both a commodity and a form of currency. Its intrinsic value, historical significance, and universal acceptance make it a preferred asset for investors seeking stability and wealth preservation. The allure of gold lies not only in its physical properties but also in its […]
Effective Risk Control Script for Business Success

Risk control is a fundamental aspect of effective business management, serving as a safeguard against potential threats that could undermine an organization’s objectives. In an increasingly complex and interconnected world, businesses face a myriad of risks ranging from financial uncertainties to operational disruptions and reputational damage. The importance of risk control lies not only in […]
Optimize Your Trades with Position Sizing Tool

Position sizing is a critical component of risk management in trading and investing. It refers to the number of units or shares of a particular asset that a trader decides to buy or sell in a single transaction. The concept is rooted in the idea that the amount of capital allocated to a trade should […]
Revolutionizing Energy Distribution with Automated Grid System

The global energy landscape is undergoing a seismic shift, driven by the urgent need for sustainable practices and the integration of renewable energy sources. Traditional energy distribution systems, characterized by centralized power generation and one-way electricity flow, are increasingly inadequate in meeting the demands of modern society. As populations grow and urbanize, the strain on […]
Maximize Profits with Premium Forex Bot
The foreign exchange market, commonly referred to as Forex or FX, is the largest and most liquid financial market in the world. With a daily trading volume exceeding $6 trillion, it dwarfs other markets such as stocks and commodities. The Forex market operates 24 hours a day, five days a week, allowing traders from all […]