Introduction
TradingView is a popular trading platform that provides a comprehensive suite of tools for traders to analyze financial markets. Effective trading strategies are crucial for navigating the complexities of market movements and making informed decisions. In 2024, various best TradingView strategies have emerged, designed to enhance your trading performance.
In this article, you will learn about:
- Reversal Entry Model: Identifying structural changes and key demand zones.
- Trend-Following Strategies: Utilizing indicators like moving averages and MACD.
- Momentum Strategies: Leveraging RSI and Stochastic Oscillator for momentum trades.
- Breakout and Retest Strategy: Trading breakouts with risk management techniques.
- Fibonacci Retracement Strategy: Recognizing reversal points using Fibonacci levels.
- Bollinger Band Squeeze/MACD Strategy: Combining volatility analysis with momentum confirmation.
- Keltner Channel/RSI Momentum Strategy: Identifying trade opportunities within strong trends.
- Moving Average Crossovers: Understanding signals from golden and death crosses.
- Scalping Strategies: Executing rapid trades on short timeframes.
You’ll also discover backtesting techniques to refine these strategies using TradingView’s powerful tools. By the end of this article, you’ll have a detailed understanding of how to apply these trading techniques effectively in 2024.
Understanding Trading Strategies
Trading strategies are systematic methods that traders use to decide when to buy or sell assets in financial markets. These strategies combine technical analysis, statistical data, and market trends to make informed decisions. Effective trading strategies aim to maximize profits while managing risk.
Aligning trading strategies with market conditions and personal trading styles is crucial for success. Markets can be bullish, bearish, or range-bound, affecting the effectiveness of different strategies. Personal trading styles—whether you’re a day trader, swing trader, or long-term investor—also influence strategy selection. A mismatch can lead to suboptimal results and increased risks.
Different types of trading strategies serve various purposes:
- Reversal Entry Model: Focuses on identifying market reversals using structural changes.
- Trend-Following Strategies: Leverages indicators like moving averages and MACD to follow prevailing trends.
- Momentum Strategies: Utilizes momentum indicators such as RSI and Stochastic Oscillator to capture price momentum.
- Breakout and Retest Strategy: Trades based on breakouts from horizontal ranges or consolidation phases.
- Fibonacci Retracement Strategy: Uses Fibonacci levels to identify potential reversal points in trending markets.
- Bollinger Band Squeeze/MACD Strategy: Combines Bollinger Bands’ volatility analysis with MACD for identifying breakouts.
- Keltner Channel/RSI Momentum Strategy: Leverages Keltner Channels and RSI readings to manage trades within strong trends.
- Moving Average Crossovers: Uses golden crosses and death crosses as signals for buying or selling opportunities.
- Scalping Strategies: Designed for quick trades based on small price movements using 3–5 minute charts.
Effective use of these strategies involves understanding their core principles and knowing when and how to apply them based on current market conditions and your own trading style.
1. Reversal Entry Model
The Reversal Entry Model focuses on pinpointing structural changes in market trends to capitalize on potential reversals. This strategy revolves around detecting breakouts and retests, which signal shifts in market direction.
Identifying Structural Changes
To identify structural changes, traders look for breakouts from established price ranges and confirm these movements through retests. A breakout occurs when the price moves beyond a significant support or resistance level. Following the breakout, a retest involves the price revisiting this key level, providing an opportunity to enter the trade.
Importance of Higher Timeframes
Starting with higher timeframes, such as the H4 (4-hour) chart, is crucial for this strategy. Higher timeframes offer a broader view of market trends and reduce the noise caused by short-term fluctuations, making it easier to identify genuine breakouts and retests.
Key Components
- Demand Zones: These are areas where buying interest is strong enough to prevent the price from falling further. Identifying demand zones helps in spotting potential reversal points.
- Liquidity Accumulation: Observing liquidity accumulation provides insights into where large institutional players might be placing their orders. This can indicate potential areas of price movement.
- Significant Movements: Recognizing substantial upward or downward movements aids in confirming that a genuine structural change is taking place.
Example:
Imagine you are trading EUR/USD on an H4 chart. You notice the price breaking above a resistance level at 1.2000 and then retesting this level. By identifying this breakout and subsequent retest within a demand zone, you can anticipate a potential upward movement.
The Reversal Entry Model relies heavily on understanding market structure and utilizing higher timeframes to filter out false signals. By focusing on demand zones and liquidity accumulation, traders can better predict significant price movements and enhance their trading performance.
2. Trend-Following Strategies
Trend-following strategies are designed to capitalize on sustained market movements, allowing you to ride significant trends and maximize profits. These strategies utilize various technical indicators to determine the best entry and exit points.
Key Indicators
Moving Averages
- Simple Moving Average (SMA): Calculated by averaging the price over a specified number of periods, providing a smooth representation of price movements.
- Exponential Moving Average (EMA): Gives more weight to recent prices, making it more responsive to recent market changes.
MACD (Moving Average Convergence Divergence)
- Consists of the MACD line (difference between 12-day EMA and 26-day EMA), the signal line (9-day EMA of MACD line), and a histogram showing the difference between MACD and its signal line.
- Entry Signal: When the MACD line crosses above the signal line.
- Exit Signal: When the MACD line crosses below the signal line.
Implementation Techniques
Using ADX for Confirming Trends
The Average Directional Index (ADX) is crucial for confirming trend strength.
- Reading Above 25: Indicates a strong trend.
- Reading Below 20: Suggests a weak or non-existent trend.
Practical Tips for Executing Trades
- Identify Trend DirectionUse moving averages to confirm whether an asset is in an uptrend or downtrend.
- For instance, if the short-term EMA is above the long-term EMA, it signals an uptrend.
- Confirm Trend StrengthCheck ADX readings to ensure that you are not entering during a weak trend.
- An ADX value above 25 supports a strong trending market suitable for executing trades.
- Entry PointsLook for crossovers in moving averages as entry signals.
- Utilize MACD crossovers as additional confirmation for entering trades.
- Exit PointsSet exit points based on moving average crossovers signaling trend reversals.
- Use MACD signals in conjunction with moving averages to determine optimal exit points.
By leveraging these indicators and techniques, you can effectively implement trend-following strategies on TradingView, enhancing your ability to identify profitable trading opportunities.
3. Momentum Strategies
Momentum trading uses price movements to make profits, especially in markets that are trending. This strategy is based on the idea that stocks or assets that have been doing well will continue to do so in the short term.
Using RSI and Stochastic Oscillator
To effectively capture price momentum, you can use indicators like the Relative Strength Index (RSI) and the Stochastic Oscillator. Choosing technical indicators like these can significantly enhance your trading strategy:
- RSI: The RSI measures the speed and change of price movements on a scale from 0 to 100. Typically, an RSI above 70 indicates that a security is overbought, while an RSI below 30 suggests it is oversold.
- Stochastic Oscillator: This indicator compares a particular closing price of a security to its price range over a specified period. It ranges from 0 to 100; readings above 80 indicate overbought conditions, while readings below 20 suggest oversold conditions.
How to Implement the Strategy
Executing momentum strategies involves identifying precise entry and exit signals:
Entry Signals
- When the RSI crosses above the 30 level, it may signal a buying opportunity, indicating that the security has shifted from an oversold condition.
- Similarly, when the Stochastic Oscillator shows %K line crossing above the %D line (especially when both are below the 20 level), it can indicate upward momentum.
Exit Signals
- An RSI crossing below the 70 level might indicate it’s time to sell or take profits as the security could be moving out of its overbought state.
- For the Stochastic Oscillator, if the %K line crosses below the %D line while both are above 80, it signals potential downward momentum.
Understanding Market Conditions
To execute momentum trades effectively, you need to thoroughly analyze market conditions:
- Trending Markets: Momentum strategies work best in strongly trending markets where clear directional movements are evident.
- Confirmation Tools: Use other technical tools such as trend lines or moving averages to confirm signals from RSI and Stochastic Oscillator. This reduces false signals and increases trade reliability.
By integrating these indicators and techniques into your trading strategy, you can enhance your ability to identify profitable trading opportunities within momentum-driven markets.
4. Breakout and Retest Strategy
The breakout strategy is a powerful approach for trading in horizontal ranges or during consolidation phases. This strategy involves identifying key levels where price movements are likely to break out, followed by a retest of these levels before continuing in the breakout direction.
How Breakout and Retest Works
1. Identifying Breakouts
First, find important horizontal support and resistance levels within a consolidation phase. When the price breaks through these levels with significant volume, it suggests a possible breakout.
2. Confirming with Retests
After the initial breakout, prices often come back to test the broken level again. This retest acts as confirmation that the breakout is valid. Traders watch for price rejection at this level to enter trades with more confidence.
Setting Limit Orders
To make the most of breakouts, it’s crucial to set limit orders strategically:
- Entry Orders: Place limit orders at the breakout point or slightly above/below it, depending on which way the breakout is going. This ensures you enter the trade at a good price.
- Stop-Loss Orders: Put stop-loss orders outside the range, beyond the retest level. This reduces risk by exiting trades if the breakout fails and price goes back into the consolidation range.
- Take-Profit Levels: Decide on take-profit levels based on important support or resistance zones that match your risk-reward ratio.
Managing Risk Effectively
Managing risk well is key to successful trading using the breakout and retest strategy:
- Risk-Reward Ratios: Aim for a minimum risk-reward ratio of 1:2 or higher. This makes sure potential profits are greater than losses, improving overall trade profitability.
- Position Sizing: Adjust how much you invest according to your risk tolerance and account size. Avoid using too much leverage, which can lead to big losses.
Analyzing Potential Trades
When assessing possible breakout trades:
- Volume Analysis: Confirm breakouts with increased trading volume. High volume during breakouts shows strong market interest, supporting the move.
- Market Conditions: Look at broader market conditions to make sure they fit your strategy. Breakouts in trending markets tend to be more dependable than those in choppy or uncertain conditions.
By mastering these mechanics and incorporating proper risk management techniques, you enhance your ability to execute successful trades using the breakout and retest strategy on TradingView.
5. Fibonacci Retracement Strategy
Using Fibonacci retracement levels helps traders identify potential reversal points in trending markets. This strategy is based on the idea that prices often retrace a predictable portion of a move before continuing in the original direction.
Key Components:
- Identifying Trends: Start by determining the start and end points of a significant price movement, either upward or downward.
- Plotting Fibonacci Levels: On TradingView, use the Fibonacci retracement tool to plot levels typically set at 23.6%, 38.2%, 50%, 61.8%, and 78.6% of the price move.
Recognizing Rejection Signals:
- Price Reaction at Key Levels: Watch how the price reacts when it approaches these retracement levels. A strong rejection signal might include a candlestick pattern like a pin bar or engulfing pattern.
- Confirmation with Volume: Increased trading volume at these levels strengthens the case for a potential reversal.
This strategy leverages historical price behavior to anticipate future movements, making it one of the best TradingView strategies for analyzing market reversals efficiently.
By incorporating Fibonacci retracement levels in your trading toolkit, you gain a systematic approach to identifying key support and resistance zones, enhancing your decision-making process.
6. Bollinger Band Squeeze/MACD Strategy
Combining Bollinger Bands with the MACD indicator can provide a robust approach for identifying potential breakouts during low volatility periods. Bollinger Bands, known for their volatility analysis, expand and contract based on market activity. When the bands narrow, it signals a period of low volatility, often referred to as a “squeeze.”
Key Components:
- Bollinger Bands’ Volatility Analysis: Tracks the price’s standard deviation from a simple moving average (SMA). A squeeze indicates low volatility.
- MACD Momentum Confirmation: Uses moving averages to identify momentum shifts. The MACD line crossing above the signal line suggests bullish momentum, while crossing below indicates bearish momentum.
Identifying Breakouts:
- Detecting Squeeze: Look for Bollinger Bands narrowing significantly, which indicates reduced market volatility.
- Confirming Momentum: Use the MACD to confirm the direction of the impending breakout.
- Bullish Breakout: If MACD crosses above its signal line during a squeeze.
- Bearish Breakout: If MACD crosses below its signal line during a squeeze.
Practical Implementation:
- Set up Bollinger Bands and MACD on your TradingView chart.
- Monitor for periods where Bollinger Bands narrow.
- Observe the MACD indicator for momentum confirmation.
- Place trades based on confirmed breakouts with corresponding stop-loss orders outside recent ranges to manage risk effectively.
By combining these tools, traders can capitalize on significant price moves following periods of consolidation, enhancing trade accuracy and profitability.
7. Keltner Channel/RSI Momentum Strategy
The Keltner Channel/RSI Momentum Strategy uses Keltner Channels and the Relative Strength Index (RSI) to find trading opportunities in strong trends. Here’s how you can use these tools effectively:
- Price Movements Outside Keltner Channels: Keltner Channels, based on the Average True Range (ATR), help identify volatility and potential breakout points. When prices move outside these channels, it often indicates a strong trend.
- Confirmation with RSI Readings: The RSI is crucial for confirming these breakouts. An RSI reading above 70 indicates an overbought condition, while a reading below 30 suggests an oversold condition. These levels help you gauge the strength of the trend and validate potential entries or exits.
Identifying Trade Opportunities
Entry Points
- Watch for price breaking above or below the upper or lower Keltner Channel.
- Confirm this movement with RSI readings. For long positions, ensure RSI is not in the overbought zone; for short positions, check that RSI is not in the oversold zone.
Exit Points
- Use trailing stop losses just inside the Keltner Channels to protect gains.
- Monitor RSI for signs of divergence, indicating potential trend reversals.
Example Scenario
If EUR/USD breaks above its upper Keltner Channel with an RSI reading around 60 (indicating room for more upside), consider entering a long position. Set a trailing stop loss just below the middle band of the Keltner Channel to manage risk effectively.
This strategy helps capture strong trends while providing clear entry and exit signals, thereby enhancing trading precision and profitability.
8. Moving Average Crossovers
Moving average crossovers are crucial in trading strategies, acting as key indicators for when to buy and sell. By understanding these crossovers, you can make informed decisions that align with market trends.
Golden Cross
A golden cross happens when a short-term moving average crosses above a long-term moving average. This crossover usually signals an upward market trend, indicating a buying opportunity. For example:
- Short-term MA: 50-day moving average
- Long-term MA: 200-day moving average
When the 50-day MA crosses above the 200-day MA, it suggests upward momentum, prompting traders to consider entering long positions.
Death Cross
On the other hand, a death cross forms when a short-term moving average crosses below a long-term moving average. This indicates a downward trend and suggests selling opportunities. Key points include:
- Short-term MA: 50-day moving average
- Long-term MA: 200-day moving average
If the 50-day MA crosses below the 200-day MA, it implies downward momentum, advising traders to think about exiting or shorting positions.
Practical Application
To effectively use these crossovers on TradingView:
- Set Up Moving Averages: Apply both short and long-term moving averages on your chart.
- Monitor Crosses: Watch for golden and death crosses for potential trade entries or exits.
- Confirm with Volume: Use volume indicators to confirm the strength of the trend signaled by the crossover.
Incorporating these strategies into your trading plan can enhance decision-making and improve trading results.
9. Scalping Strategies
Scalping techniques focus on short-term trades aiming to capitalize on small price movements within very short timeframes. These strategies are designed for traders who thrive on quick decision-making and can effectively manage trades during high volatility.
Utilizing 3–5 Minute Charts
Scalping typically involves using 3–5 minute charts to spot rapid entry and exit points. This timeframe allows you to:
- Monitor price action closely.
- Identify minor trends and reversals.
- Make swift trading decisions based on real-time data.
Key Elements of Effective Scalping
Quick Decision-Making: The essence of scalping lies in your ability to make rapid trading decisions. You need to be alert and ready to enter or exit trades within seconds to minutes.
Risk Management: Given the high frequency of trades, managing risk is crucial. This includes setting tight stop-loss orders to minimize potential losses and employing proper position sizing techniques.
High Volatility Handling: Scalpers often trade during periods of high market volatility when price movements are more pronounced. It’s essential to stay informed about market events and news that could trigger significant price changes.
Best Practices for Scalping
- Use Reliable Indicators:Moving Averages: Short-term moving averages (e.g., 9-period, 21-period) help identify the direction of the trend.
- Volume Indicators: High trading volumes often precede significant price movements, providing clues for potential scalping opportunities.
- Set Clear Entry and Exit Points:Define your target profit per trade.
- Use limit orders for precise entry points.
- Place stop-loss orders just outside immediate support or resistance levels.
- Maintain Discipline:Stick to your trading plan.
- Avoid overtrading; not every minute movement is an opportunity worth pursuing.
- Evaluate each trade objectively without letting emotions influence decisions.
- Leverage Technology:Utilize TradingView’s customizable alerts for real-time notifications.
- Backtest your scalping strategy using historical data to refine your approach.
Scalping strategies require a unique skill set and mindset. By focusing on quick trades, utilizing short-term charts, and maintaining disciplined risk management, you can effectively harness the opportunities presented by small price movements in volatile markets.
Backtesting Techniques
The role of backtesting in refining trading strategies
Backtesting is a crucial step in developing and refining trading strategies. By leveraging historical data, you can simulate trades and evaluate how your strategy would have performed in past market conditions. This helps to identify strengths and weaknesses before risking real capital.
Best practices for utilizing historical data to improve live trading outcomes
- Consistency: Ensure that the historical data used is consistent with the market conditions you expect to trade in.
- Comprehensive Testing: Test your strategy across different timeframes and various market conditions to ensure robustness.
- Risk Management: Incorporate realistic transaction costs and slippage into your backtesting to get an accurate performance measure.
- Iterative Refinement: Use insights from backtesting to make iterative improvements to your strategy.
Tools for Backtesting
TradingView offers several tools that facilitate efficient backtesting:
- Pine Script: TradingView’s proprietary scripting language allows you to automate and test strategies. You can write custom scripts for specific trading strategies and run them on historical data.
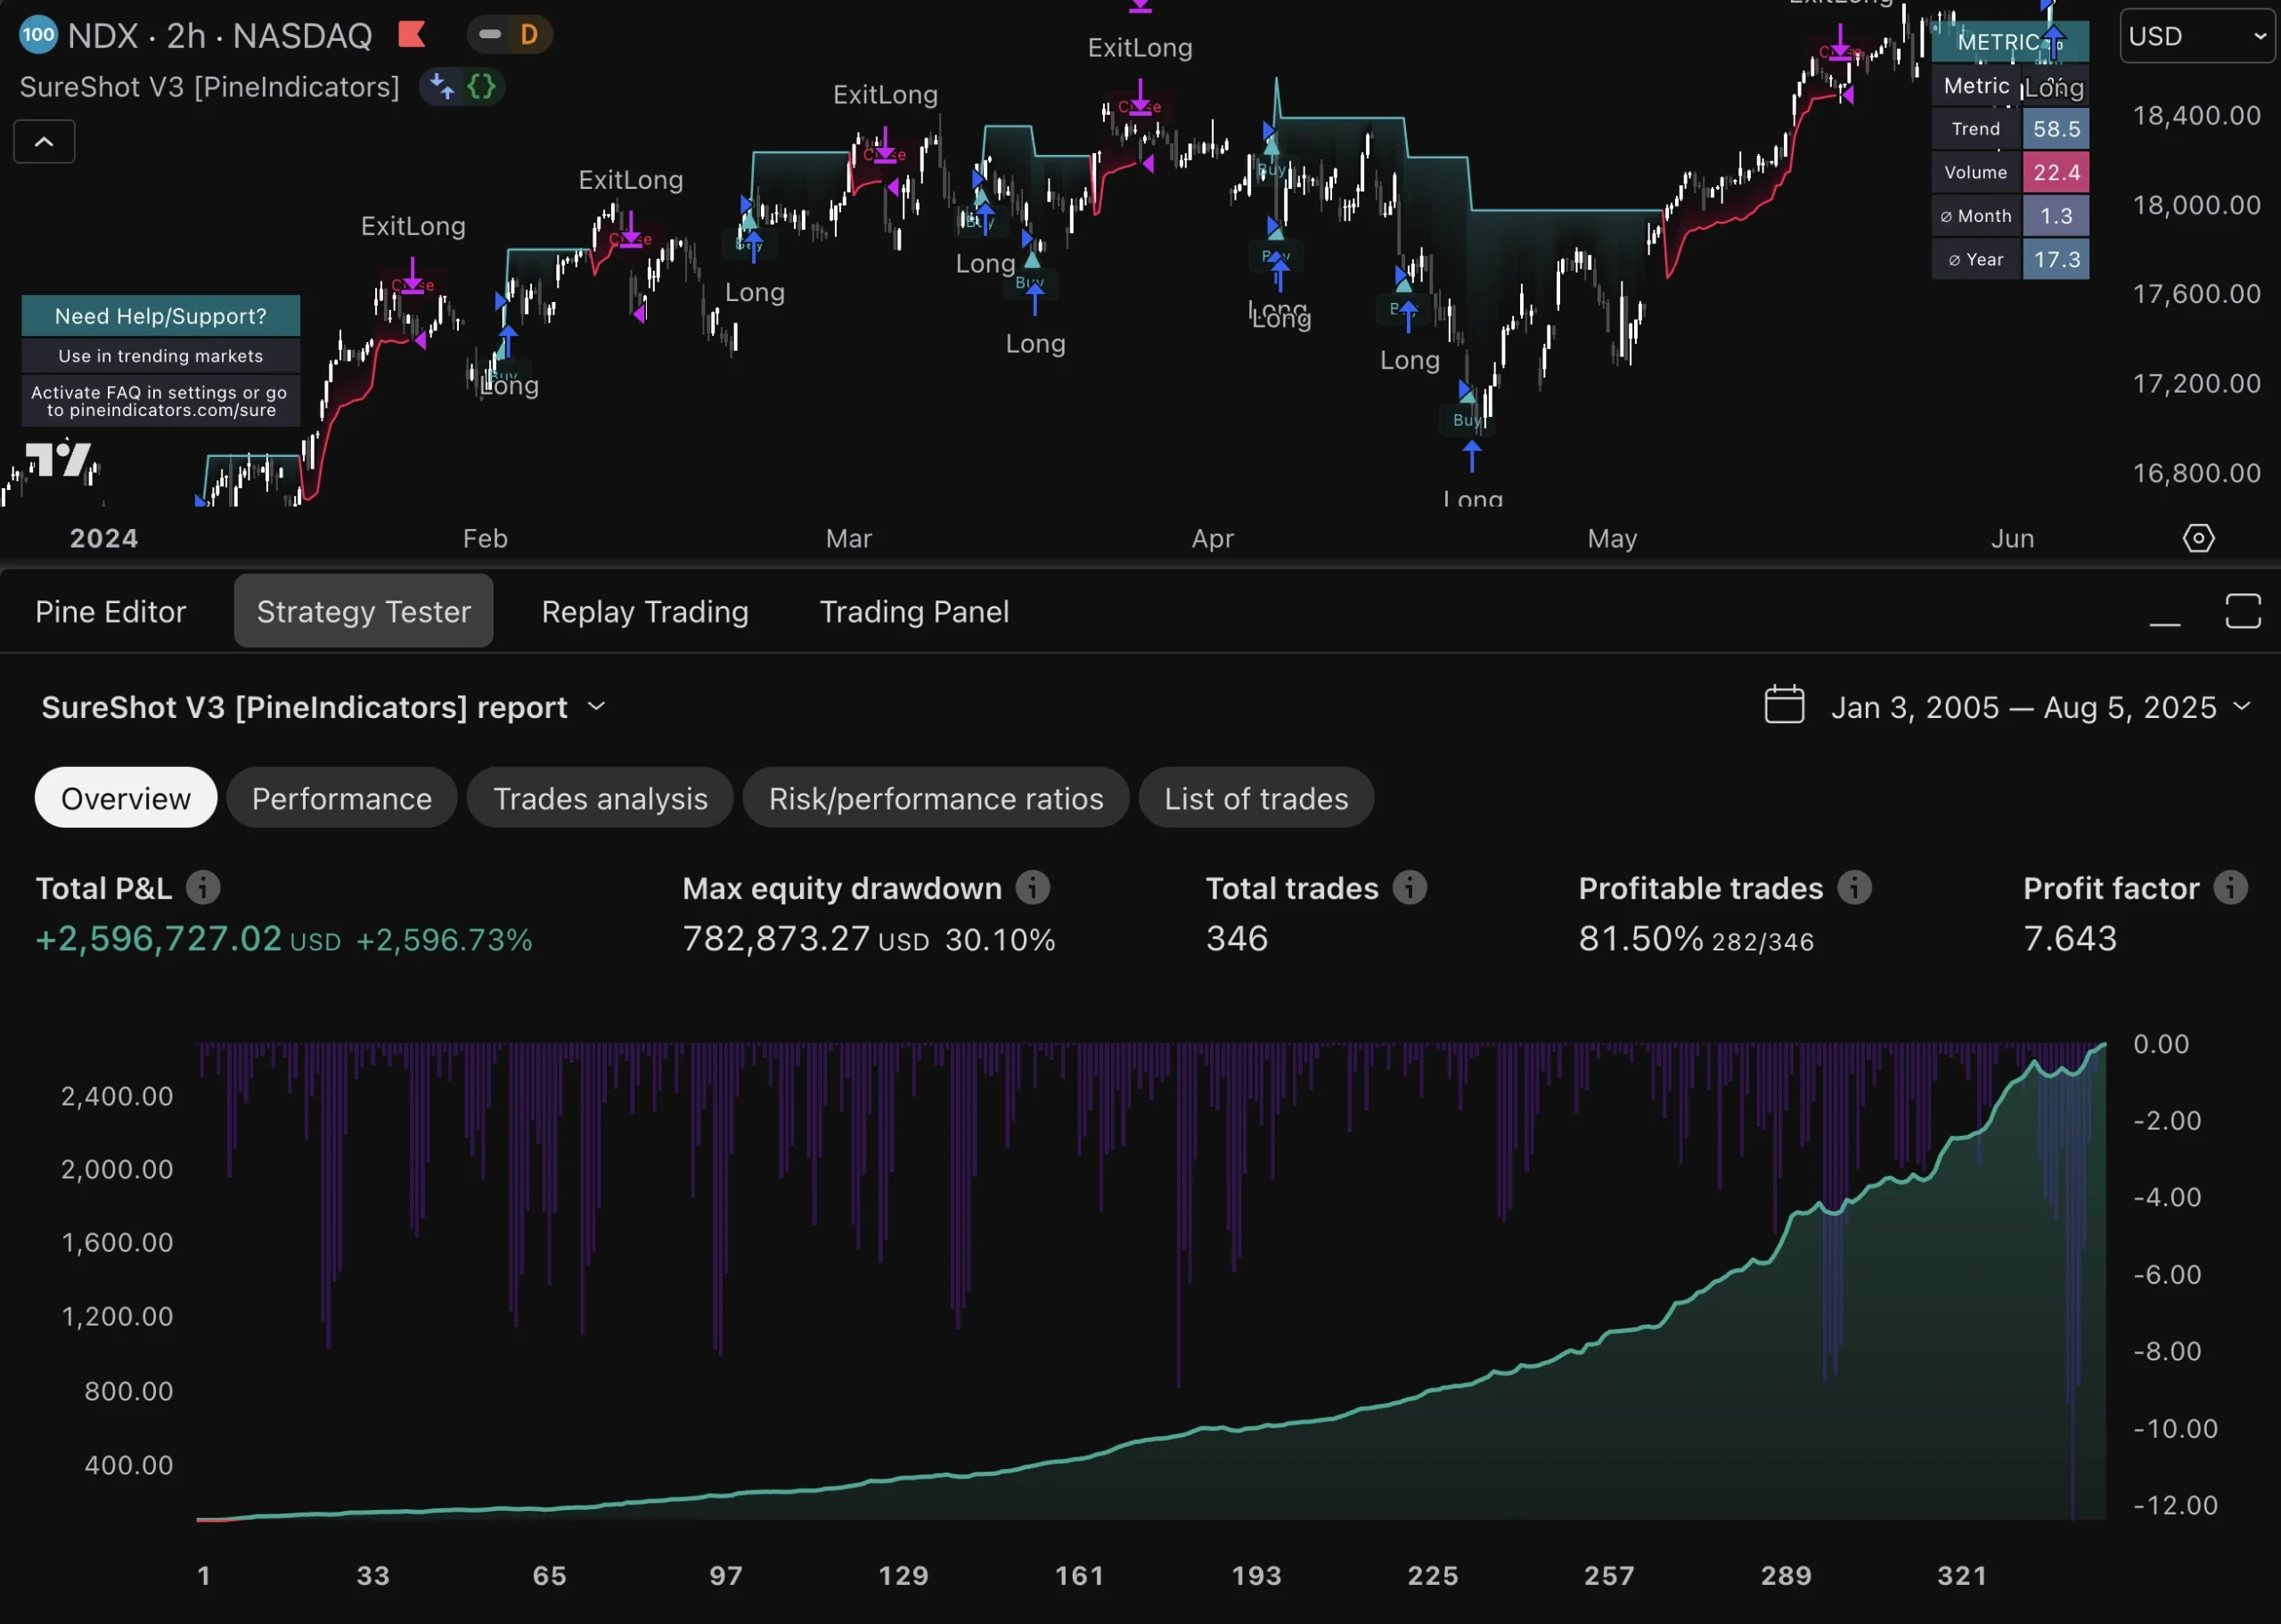
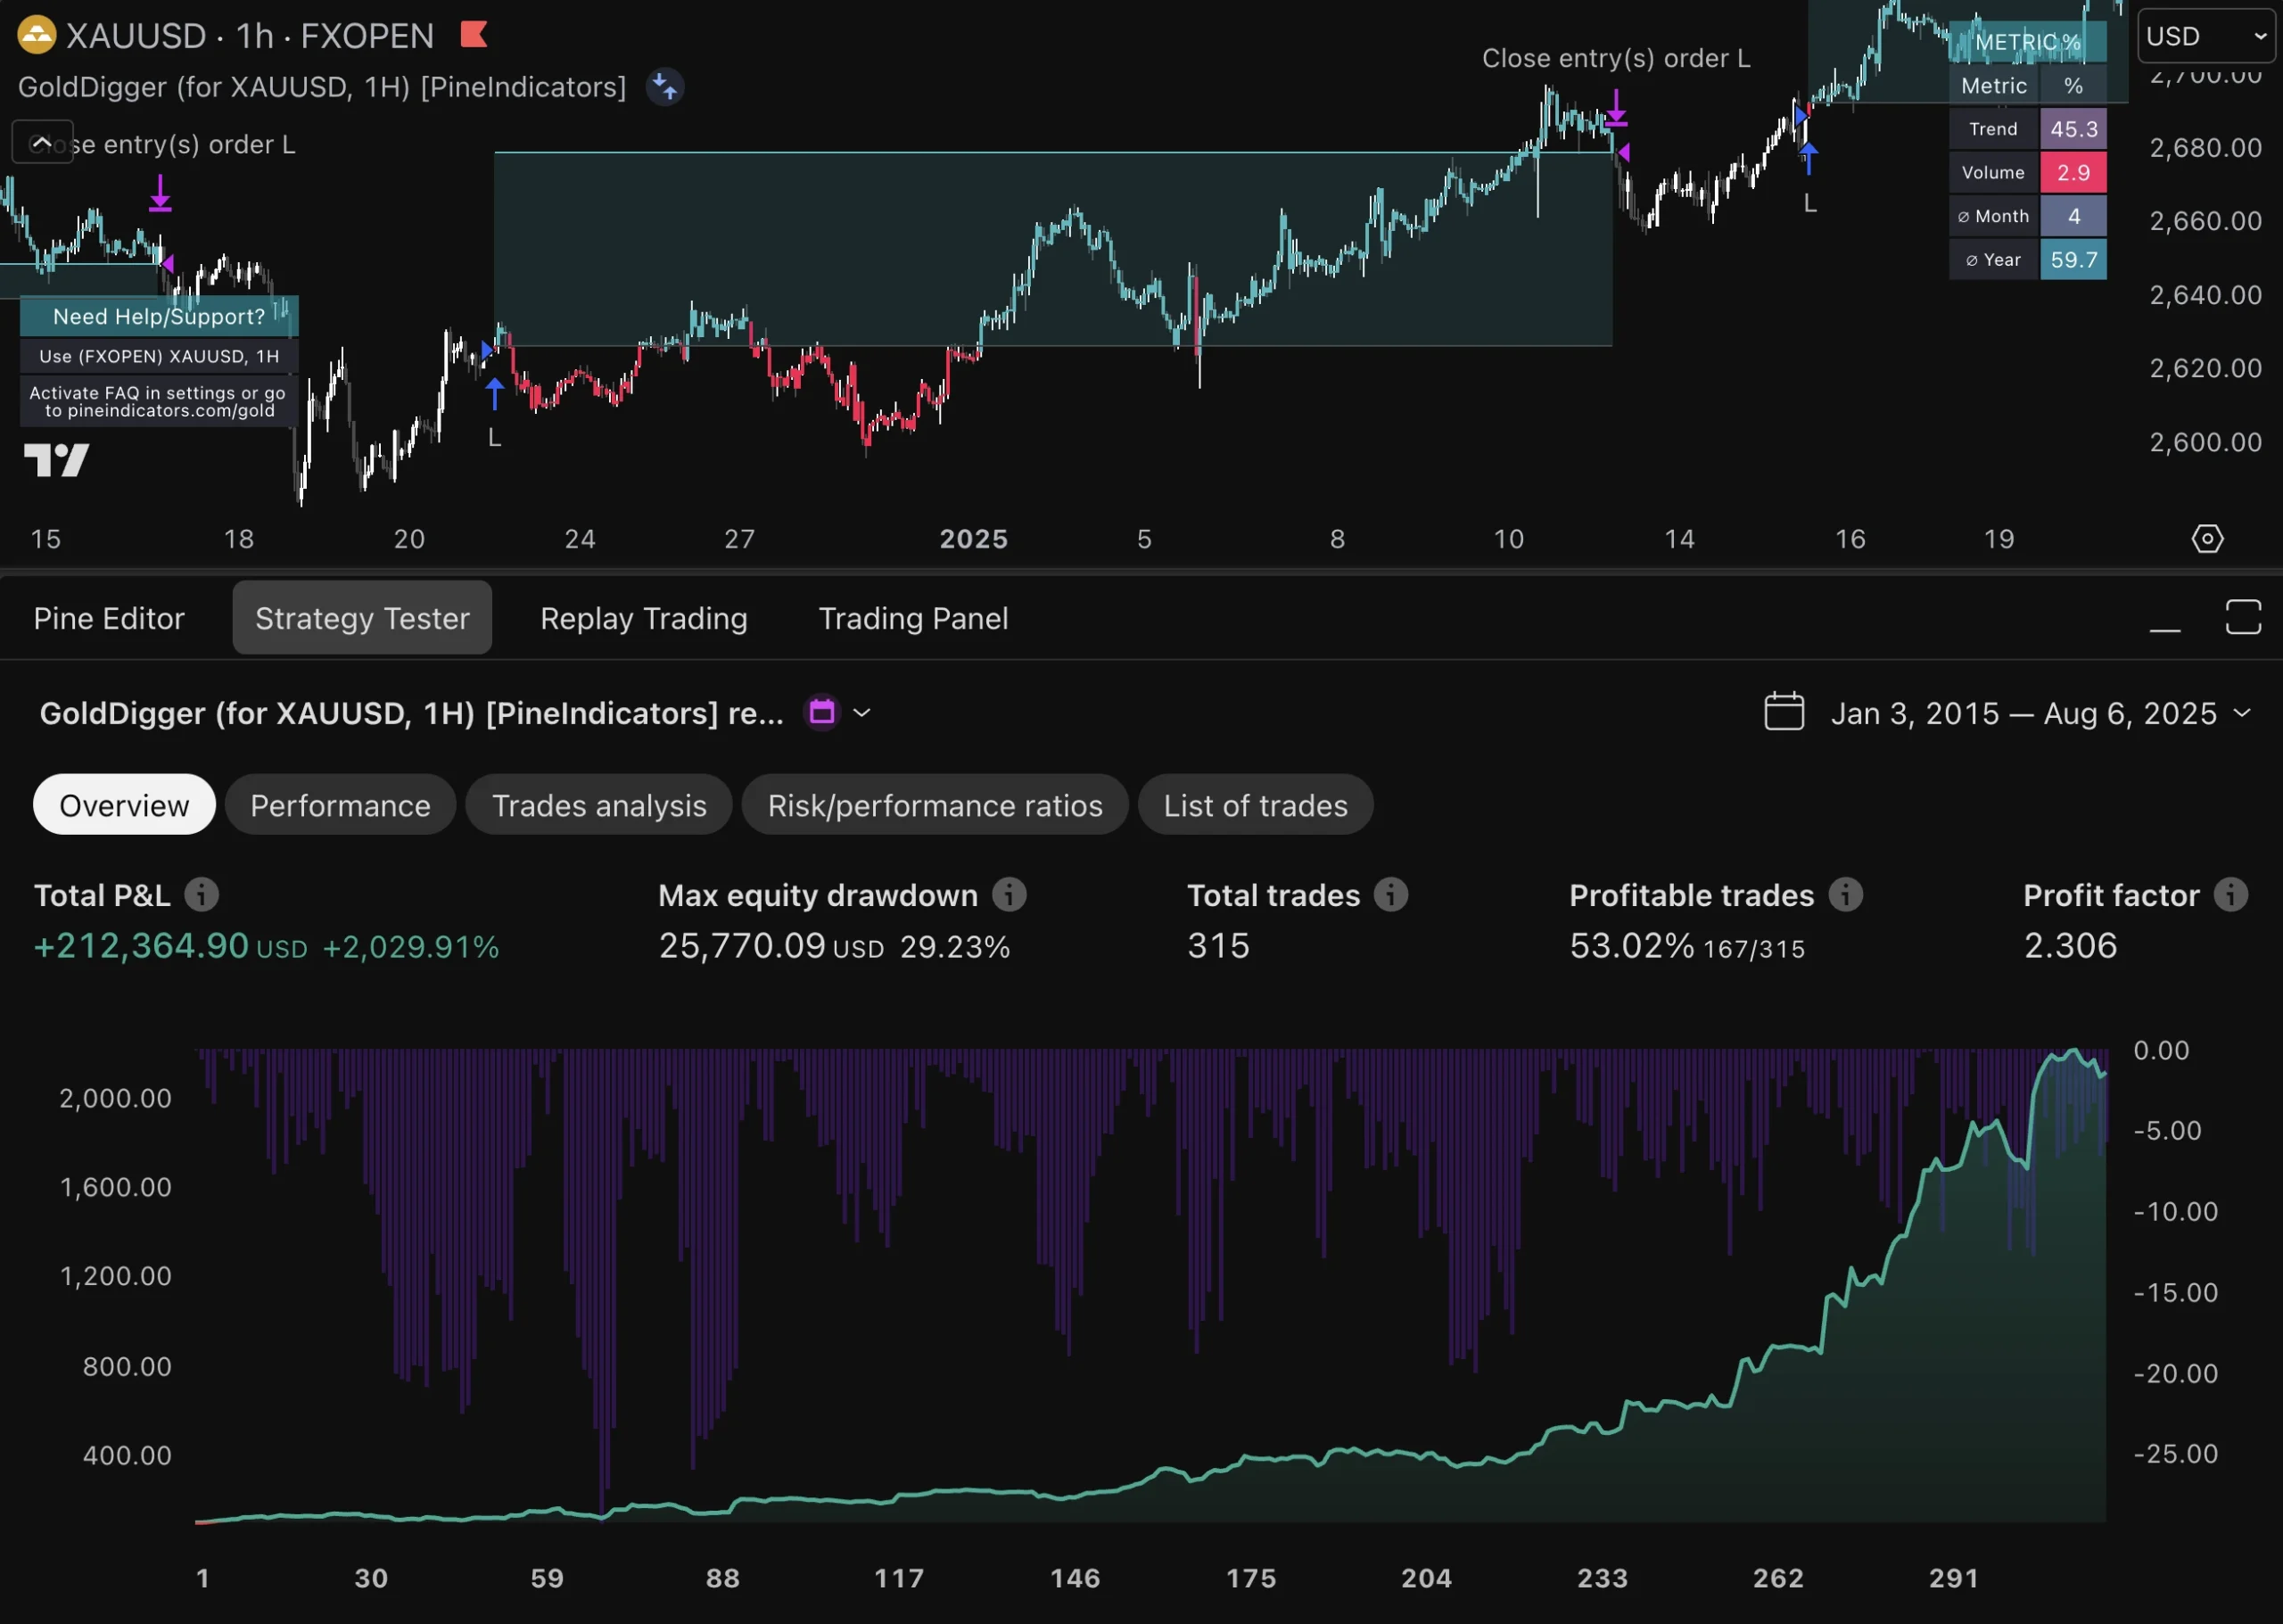
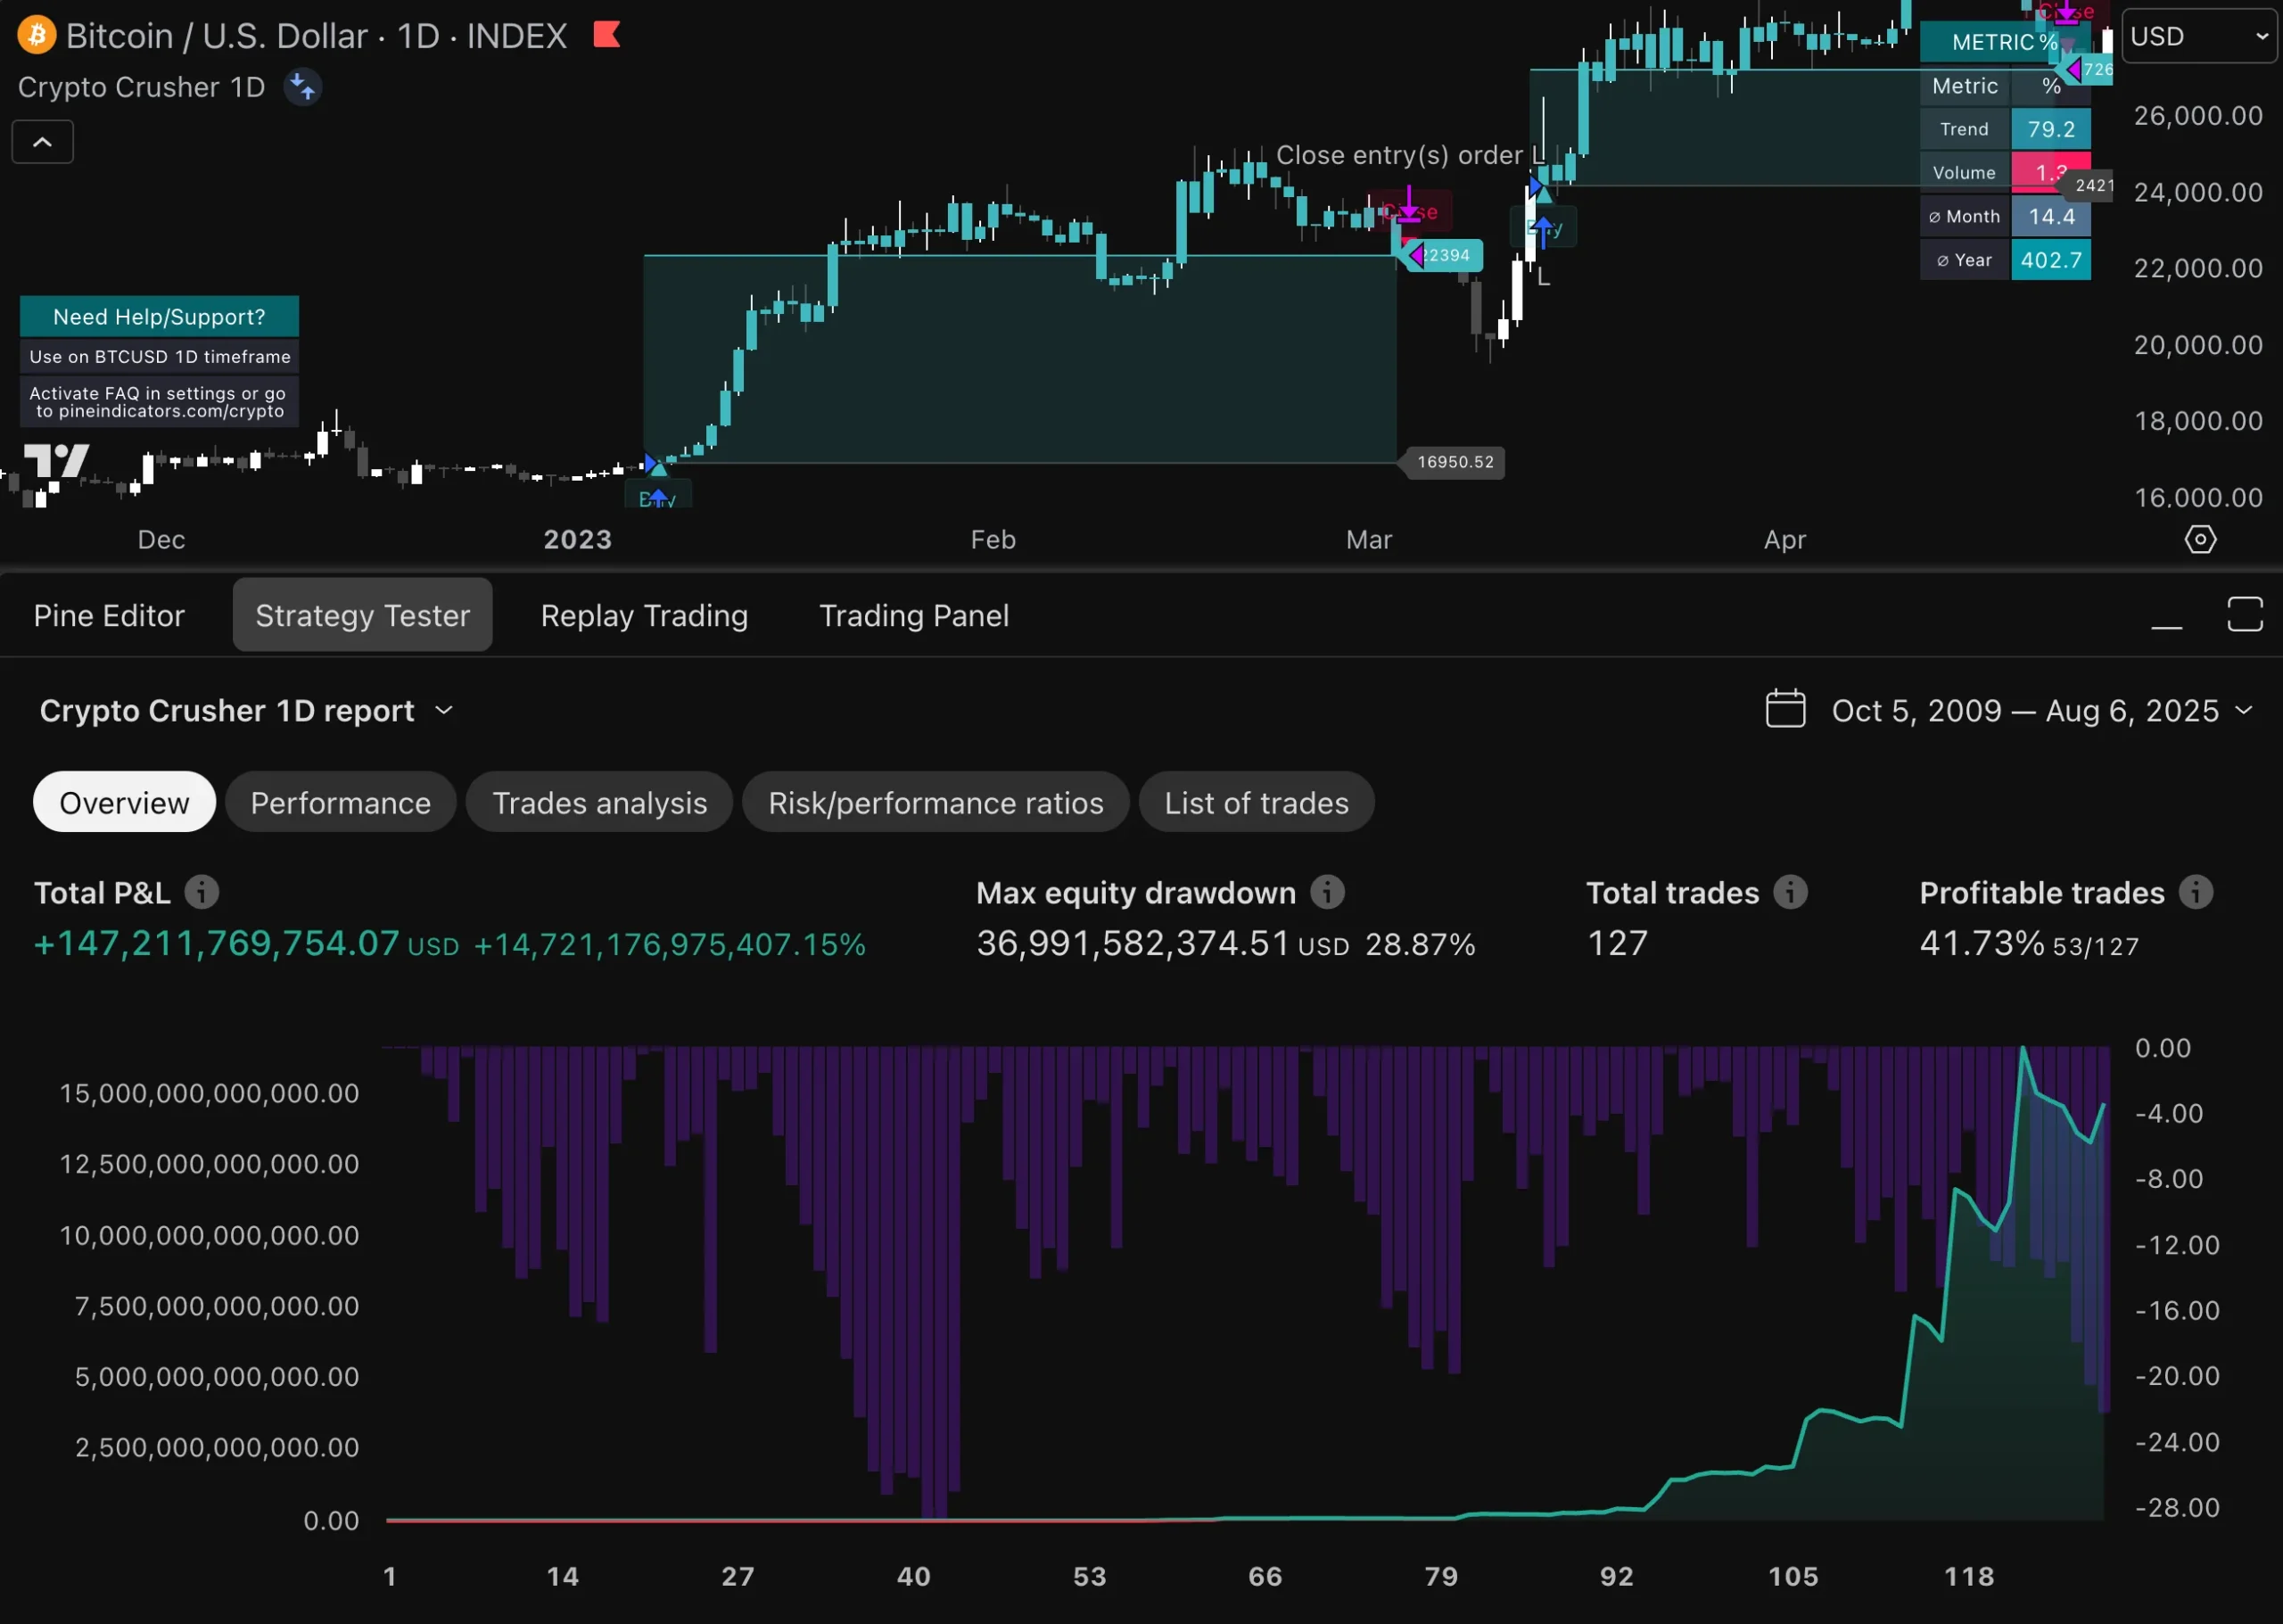
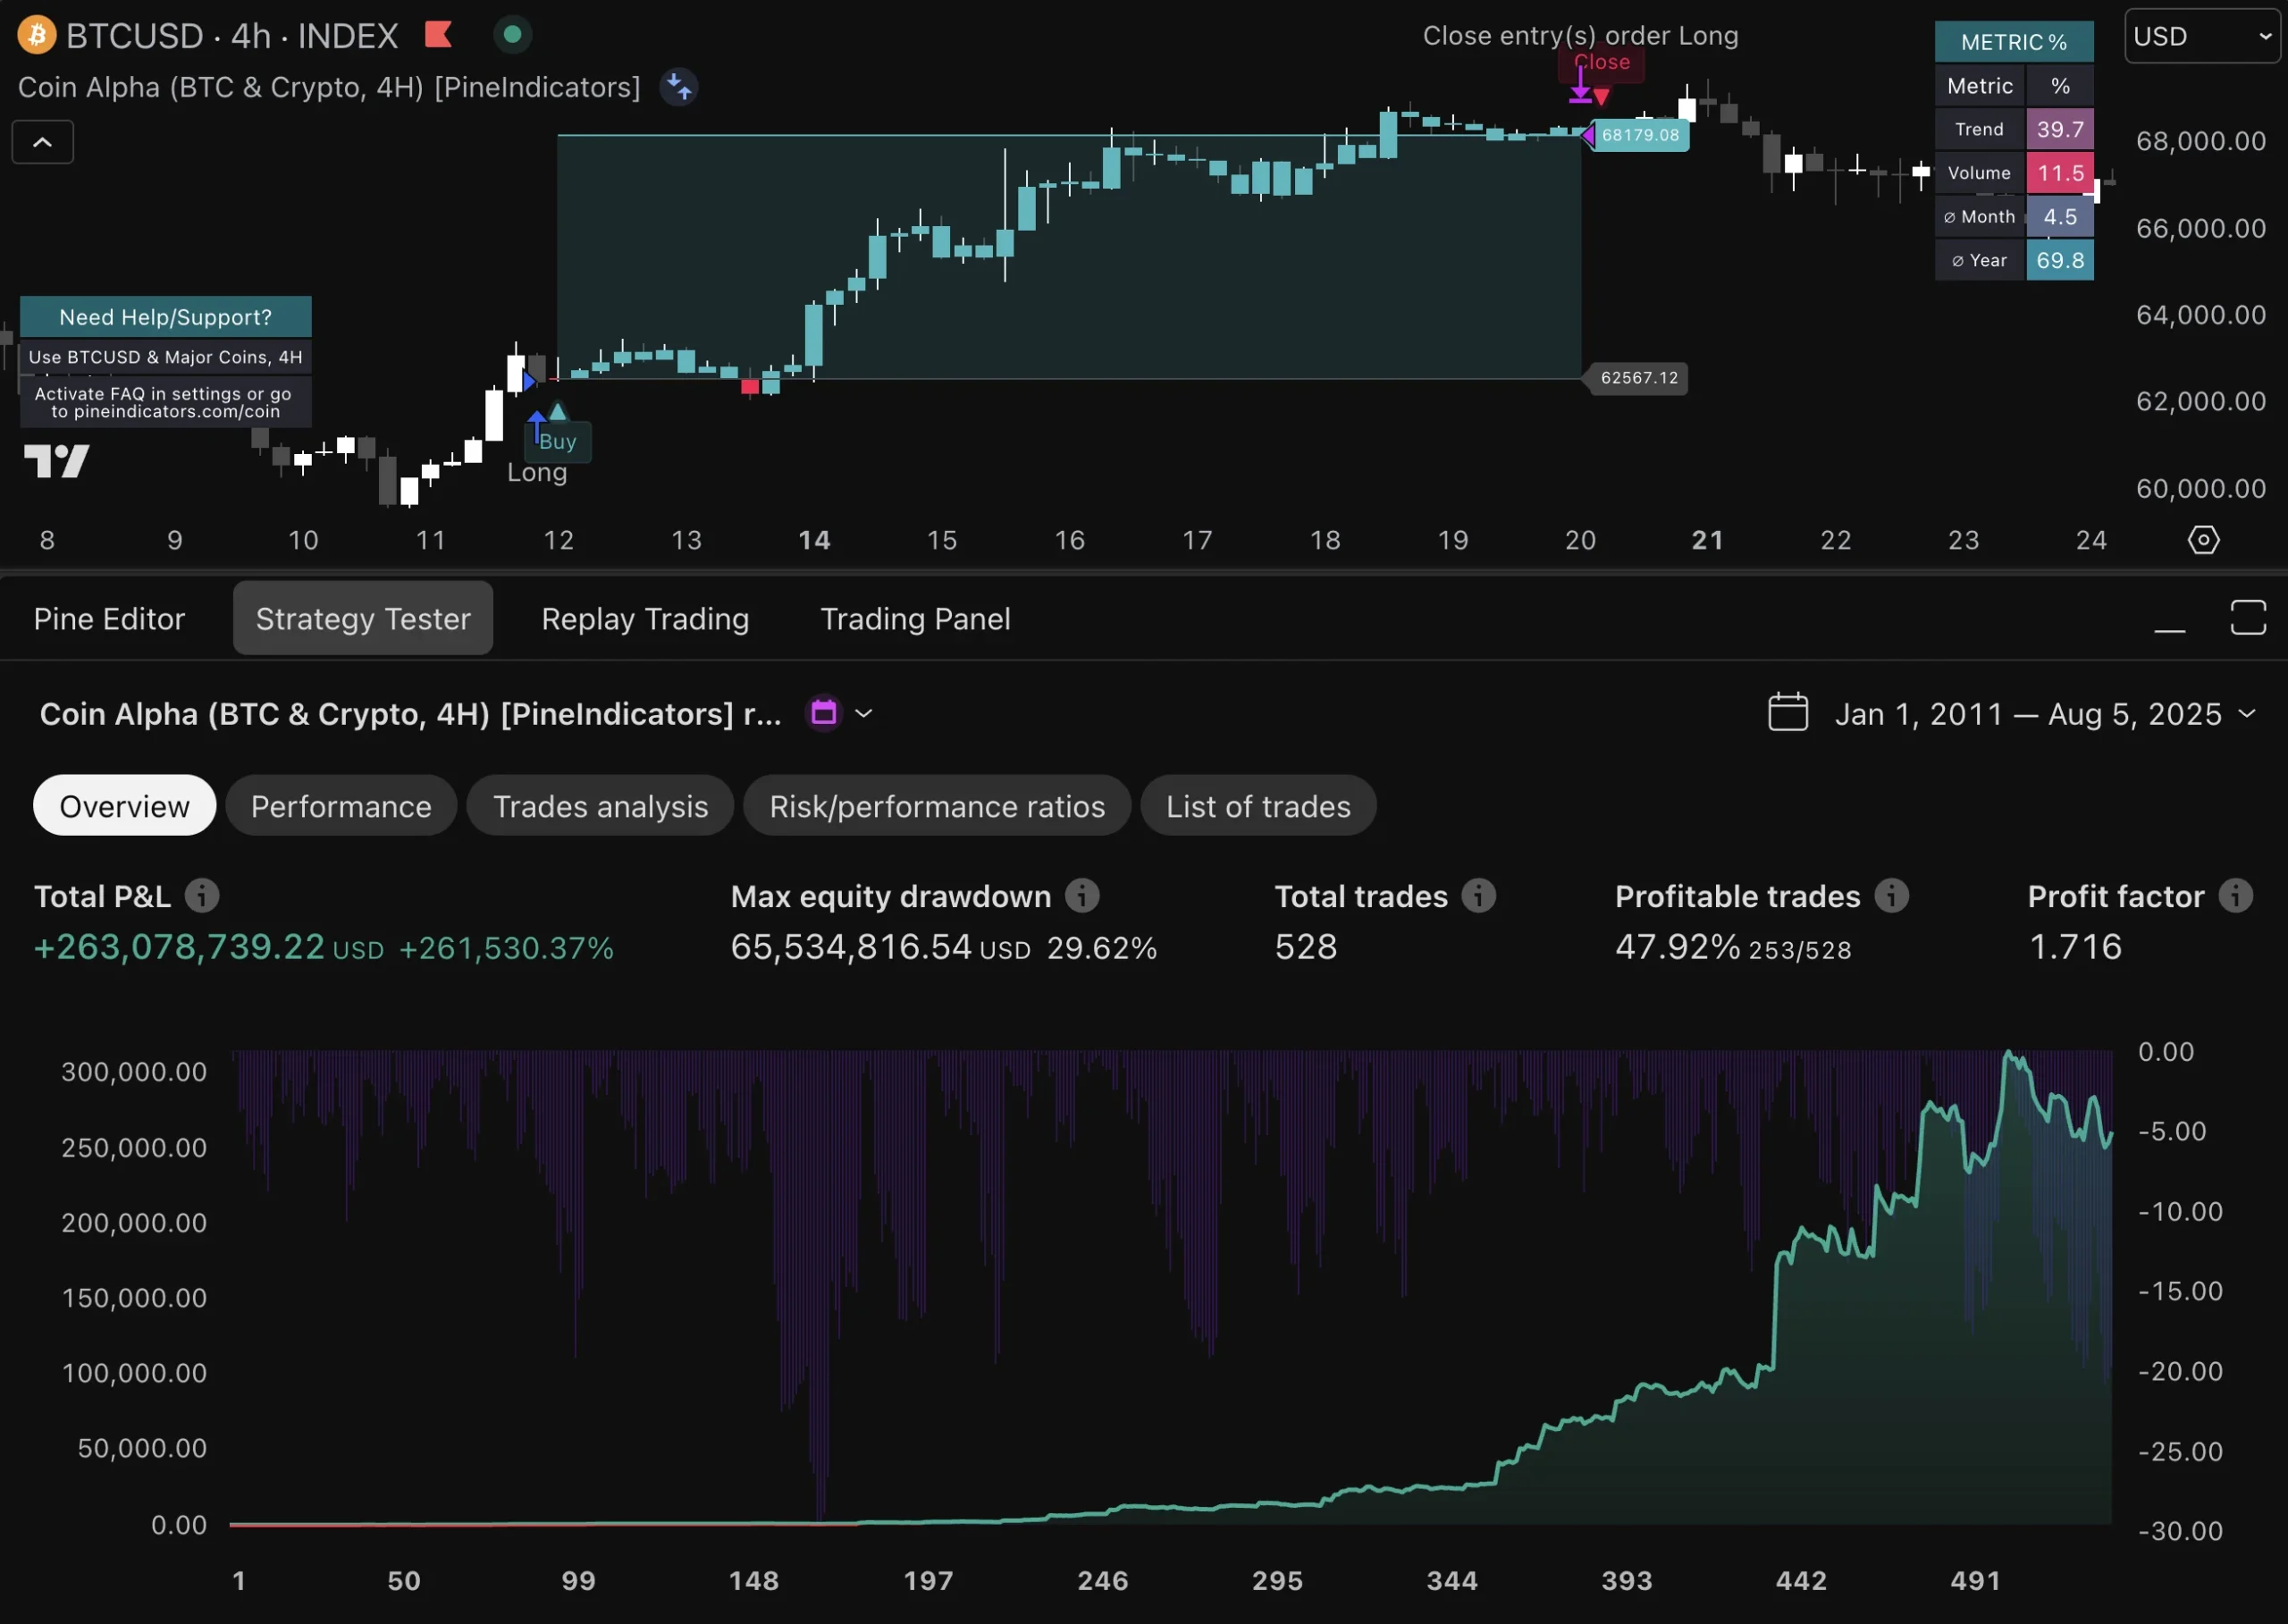
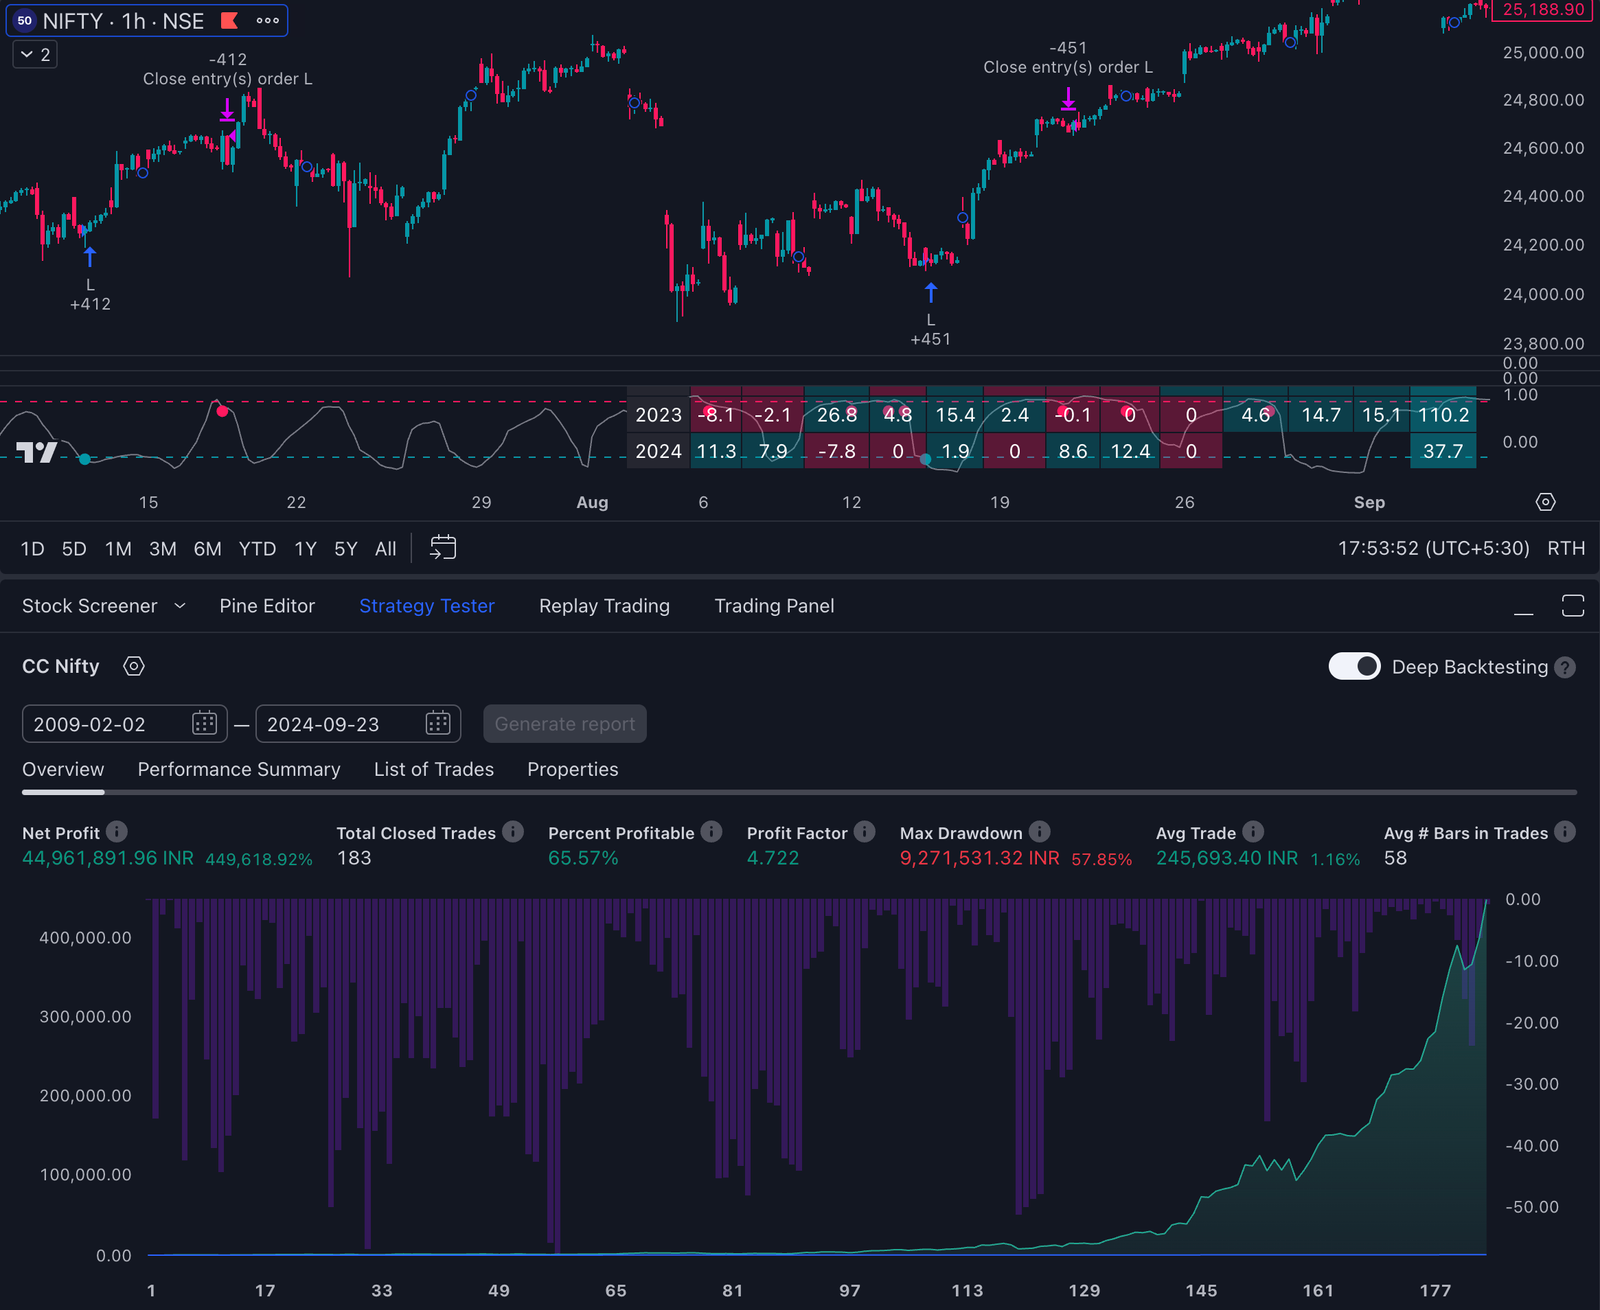
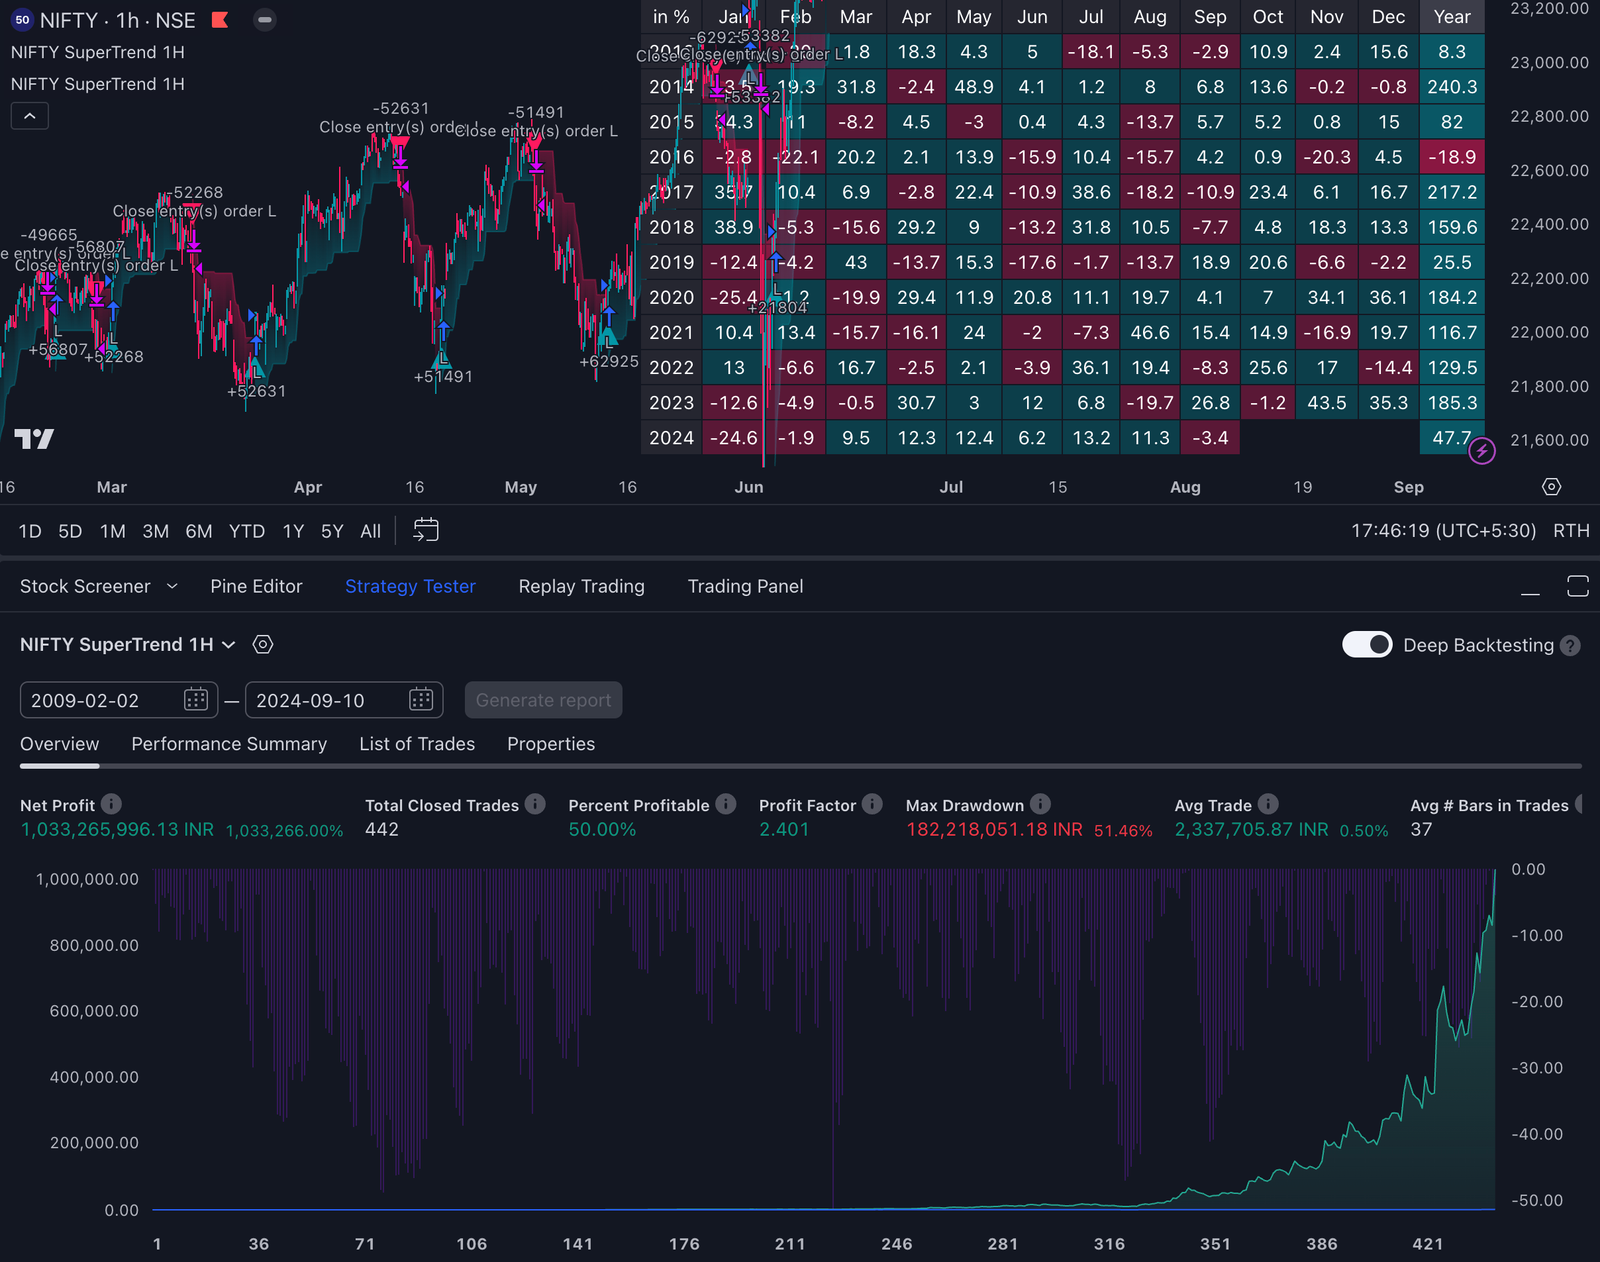
- Strategy Tester: This built-in feature lets you apply predefined or custom strategies directly onto TradingView charts, providing detailed performance analytics such as profit factor, maximum drawdown, and win rate.
- Bar Replay: This feature enables you to replay historical price action bar by bar, allowing for a more dynamic approach to strategy testing.
How to effectively analyze historical performance
- Metrics Analysis: Focus on key performance metrics such as annualized return, Sharpe ratio, and maximum drawdown.
- Visual Inspection: Review the equity curve generated by the strategy tester to assess the consistency of returns over time.
- Scenario Testing: Test your strategy under different scenarios like bull markets, bear markets, and sideways movements to gauge flexibility.
By integrating these techniques into your trading routine, you can enhance the reliability and profitability of your strategies.
Conclusion
Trading in 2024 requires a keen understanding of market dynamics and the ability to adapt strategies based on evolving conditions. The best practices in trading 2024 hinge on leveraging robust TradingView strategies that align with your personal trading style.
- Adapting Strategies: It’s essential to continuously adapt and refine your trading approaches. Utilize tools like backtesting to analyze historical performance, making informed decisions in live trading scenarios.
- Personalization: Each trader’s journey is unique. Tailor the strategies discussed—whether it’s the Reversal Entry Model, Trend-Following, or Momentum Strategies—to fit your specific needs and preferences.
- Ongoing Learning: Stay updated with market trends and new strategies. Trading is a continuous learning process, and keeping abreast of new techniques will enhance your trading performance.
Engage with these Best TradingView strategies actively, testing different approaches and refining them as you gather more experience. This proactive mindset will be instrumental in achieving success in the ever-changing financial markets.
FAQs (Frequently Asked Questions)
What is TradingView and why are effective strategies important?
TradingView is a popular trading platform that offers various tools for traders to analyze financial markets. Effective trading strategies are crucial as they help traders make informed decisions, adapt to market conditions, and improve their chances of success.
What are some common types of trading strategies?
Common types of trading strategies include reversal entry models, trend-following strategies, momentum strategies, breakout and retest strategies, Fibonacci retracement strategies, Bollinger Band squeeze/MACD strategies, Keltner Channel/RSI momentum strategies, moving average crossovers, and scalping strategies.
How do I implement a trend-following strategy?
To implement a trend-following strategy, traders can utilize indicators like moving averages and MACD to determine entry and exit points. Techniques such as using the Average Directional Index (ADX) can help confirm trends before executing trades based on trend signals.
What is the significance of backtesting in trading?
Backtesting plays a vital role in refining trading strategies by allowing traders to evaluate how their methods would have performed using historical data. This process helps improve live trading outcomes by identifying strengths and weaknesses in the strategy.
What are Fibonacci retracement levels used for?
Fibonacci retracement levels are used to identify potential reversal points in trending markets. Traders look for rejection signals at these key levels to make informed decisions about entering or exiting trades.
What should I consider when using scalping techniques?
When employing scalping techniques, it is essential to focus on quick decision-making and managing trades during high volatility periods. Utilizing short-term charts (3–5 minutes) allows traders to capitalize on small price movements effectively.

