


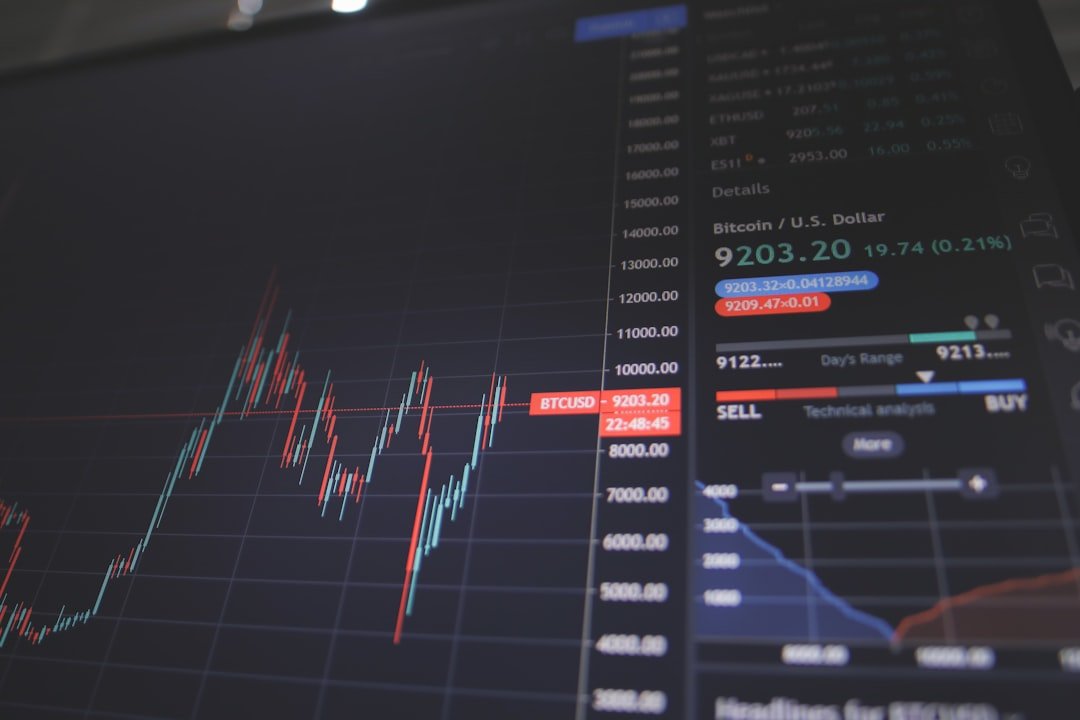
The Index Day Strategy is a trading approach that focuses on capitalizing on the daily price movements of major stock indices, such as the S&P 500, NASDAQ, or Dow Jones Industrial Average. This strategy is particularly appealing to day traders who seek to exploit short-term volatility and make quick profits. The essence of this strategy lies in its simplicity and the ability to react swiftly to market changes.
Traders employing this strategy typically analyze pre-market data, news releases, and economic indicators to gauge market sentiment before the trading day begins. One of the key components of the Index Day Strategy is the understanding of market psychology. Traders must be attuned to the collective behavior of market participants, as emotions such as fear and greed can significantly influence price movements.
For instance, if a major economic report is released that exceeds expectations, it can lead to a bullish sentiment, prompting traders to buy into the index. Conversely, disappointing news can trigger panic selling. Thus, successful implementation of the Index Day Strategy requires not only technical analysis but also a keen awareness of the broader market context.
Key Takeaways
- The Index Day Strategy involves trading on short-term price movements in the stock market.
- Analyzing market trends and patterns is crucial for making informed trading decisions.
- Identifying key entry and exit points helps maximize profits and minimize losses.
- Utilizing leveraged and inverse ETFs can amplify returns or provide hedging opportunities.
- Managing risk and position sizing is essential for long-term success in trading.
Analyzing Market Trends and Patterns
To effectively implement the Index Day Strategy, traders must develop a robust framework for analyzing market trends and patterns. This involves studying historical price movements and identifying recurring patterns that can signal potential future price action. Technical analysis tools such as moving averages, trend lines, and candlestick patterns play a crucial role in this process.
For example, a trader might observe that the S&P 500 tends to rally after a certain pattern of candlesticks forms, indicating bullish momentum. Moreover, understanding market trends extends beyond mere chart analysis; it also encompasses macroeconomic factors that can influence market direction. Economic indicators such as GDP growth rates, unemployment figures, and inflation data can provide valuable insights into the overall health of the economy and its potential impact on stock indices.
By correlating these indicators with historical price movements, traders can enhance their predictive capabilities and make more informed decisions when executing trades.
Identifying Key Entry and Exit Points

A critical aspect of the Index Day Strategy is the identification of key entry and exit points. Successful traders know that timing is everything; entering a position too early or too late can significantly affect profitability. One common method for determining entry points is to look for breakouts from established resistance levels or support levels.
For instance, if the S&P 500 breaks above a significant resistance level with high volume, it may signal a strong upward trend, prompting traders to enter long positions. Exit points are equally important and can be determined using various techniques. Some traders prefer to set profit targets based on a specific risk-reward ratio, while others may use trailing stops to lock in profits as the price moves in their favor.
Additionally, monitoring key technical indicators such as Relative Strength Index (RSI) or Moving Average Convergence Divergence (MACD) can help traders identify overbought or oversold conditions, signaling potential exit points. By combining these methods, traders can create a comprehensive plan for entering and exiting trades effectively.
Utilizing Leveraged and Inverse ETFs
| ETF Type | Performance | Risk Level |
|---|---|---|
| Leveraged ETF | 2x or 3x the daily return of an underlying index | High |
| Inverse ETF | Provides the opposite return of the underlying index | High |
Leveraged and inverse exchange-traded funds (ETFs) have gained popularity among traders looking to amplify their returns or hedge against market downturns. Leveraged ETFs aim to provide multiples of the daily performance of an underlying index, allowing traders to gain exposure to larger price movements without needing substantial capital. For example, a 2x leveraged ETF that tracks the S&P 500 would aim to deliver twice the daily return of the index.
This can be particularly advantageous for day traders who are confident in their market predictions. Conversely, inverse ETFs are designed to profit from declines in the underlying index. These funds can be an effective tool for hedging against potential losses in a long position or for speculating on downward price movements.
For instance, if a trader anticipates a bearish trend in the market due to negative economic news, they might consider purchasing an inverse ETF that tracks the S&P 500. However, it is crucial for traders to understand that both leveraged and inverse ETFs come with increased risk due to their compounding effects over time, making them more suitable for short-term trading strategies rather than long-term investments.
Managing Risk and Position Sizing
Effective risk management is paramount in any trading strategy, including the Index Day Strategy. Traders must establish clear guidelines for how much capital they are willing to risk on each trade. A common rule of thumb is to risk no more than 1-2% of total trading capital on a single trade.
This approach helps protect against significant losses that could jeopardize an entire trading account. Position sizing becomes essential in this context; determining the appropriate number of shares or contracts to trade based on account size and risk tolerance is critical for maintaining long-term viability. In addition to setting risk limits per trade, traders should also consider diversifying their positions across different sectors or indices.
For example, if a trader has long positions in both technology and healthcare indices, a downturn in one sector may be offset by stability or gains in another sector. By employing sound risk management practices and thoughtful position sizing, traders can navigate the inherent volatility of day trading while safeguarding their capital.
Implementing Stop-Loss and Take-Profit Orders

Incorporating stop-loss and take-profit orders into the Index Day Strategy is essential for automating risk management and ensuring disciplined trading practices. A stop-loss order is designed to limit potential losses by automatically closing a position when it reaches a predetermined price level. For instance, if a trader enters a long position in an index at $4,000 with a stop-loss set at $3,950, the position will be sold if the index falls to that level, thereby capping losses at $50 per share.
On the other hand, take-profit orders allow traders to lock in profits once a position reaches a specified target price. This is particularly useful in fast-moving markets where prices can fluctuate rapidly. For example, if a trader anticipates that an index will rise to $4,100 after entering at $4,000, they might set a take-profit order at that level to ensure they capture gains without having to monitor the position constantly.
By utilizing these orders effectively, traders can maintain emotional discipline and adhere to their trading plans even in volatile market conditions.
Monitoring and Adjusting the Strategy
The dynamic nature of financial markets necessitates continuous monitoring and adjustment of trading strategies. Traders employing the Index Day Strategy must remain vigilant about changes in market conditions that could impact their positions or overall strategy effectiveness. This includes keeping an eye on economic news releases, geopolitical events, and shifts in market sentiment that could lead to increased volatility or trend reversals.
Additionally, traders should regularly review their performance metrics to identify areas for improvement. Analyzing past trades can reveal patterns in decision-making that may need adjustment; for instance, if a trader consistently exits positions too early or fails to adhere to stop-loss levels, they may need to refine their approach. By maintaining flexibility and being willing to adapt their strategies based on real-time data and performance analysis, traders can enhance their chances of success in an ever-evolving market landscape.
Reviewing and Evaluating Performance
A comprehensive review and evaluation of trading performance are crucial for long-term success with the Index Day Strategy. Traders should establish a systematic approach for tracking their trades over time, including metrics such as win/loss ratios, average profit/loss per trade, and overall return on investment (ROI). This data provides valuable insights into what strategies are working effectively and which areas may require further refinement.
Moreover, performance evaluation should not solely focus on quantitative metrics; qualitative assessments are equally important. Traders should reflect on their emotional responses during trades—how fear or greed may have influenced decision-making—and consider how these factors could be managed better in future trades. By combining quantitative analysis with introspective evaluation, traders can develop a more holistic understanding of their trading behavior and make informed adjustments that align with their goals and risk tolerance.
In conclusion, mastering the Index Day Strategy requires a multifaceted approach that encompasses understanding market dynamics, analyzing trends, identifying entry and exit points, managing risk effectively, and continuously evaluating performance. By integrating these elements into their trading practice, traders can enhance their ability to navigate the complexities of day trading while striving for consistent profitability in an ever-changing financial landscape.
If you are interested in learning more about how to automate your trading strategy, check out this article on Expert Trading Automation Scripts. This article provides valuable insights on how to streamline your trading strategy using automation tools. It complements the Index Day Strategy by offering additional resources and tips for improving your trading performance.
FAQs
What is an Index Day Strategy?
An Index Day Strategy is a trading strategy that focuses on taking advantage of the price movements of stock market indices, such as the S&P 500 or the Dow Jones Industrial Average.
How does an Index Day Strategy work?
An Index Day Strategy involves analyzing the price movements of stock market indices and making trading decisions based on short-term fluctuations in the market.
What are the key components of an Index Day Strategy?
Key components of an Index Day Strategy may include technical analysis, chart patterns, volume analysis, and market sentiment indicators.
What are the potential benefits of using an Index Day Strategy?
Potential benefits of using an Index Day Strategy may include the ability to capitalize on short-term market movements, the potential for quick profits, and the opportunity to diversify trading strategies.
What are the risks associated with an Index Day Strategy?
Risks associated with an Index Day Strategy may include market volatility, potential for losses due to rapid price movements, and the need for quick decision-making.
Who can use an Index Day Strategy?
An Index Day Strategy can be used by experienced traders and investors who are familiar with the stock market and have a good understanding of technical analysis and market dynamics.
