What is MACD in Trading?
MACD, which stands for Moving Average Convergence Divergence, is a popular technical analysis indicator used in trading. It was developed by Gerald Appel in the late 1970s and has since become widely used by traders across various financial markets.
Components of MACD
The MACD indicator consists of three main components:
- MACD Line: The MACD line is calculated by subtracting the 26-day Exponential Moving Average (EMA) from the 12-day EMA. It represents the difference between these two moving averages and is the main line used for generating trading signals.
- Signal Line: The signal line is a 9-day EMA of the MACD line. It is plotted on top of the MACD line and is used to generate buy and sell signals.
- MACD Histogram: The MACD histogram represents the difference between the MACD line and the signal line. It provides a visual representation of the convergence and divergence of the two lines. When the histogram is positive, it indicates bullish momentum, while a negative histogram indicates bearish momentum.
How to Use MACD
MACD can be used in various ways to analyze market trends and generate trading signals. Here are a few common techniques:
Trend Identification:
One of the primary uses of MACD is to identify the direction of the market trend. When the MACD line is above the signal line and the histogram is positive, it suggests a bullish trend. Conversely, when the MACD line is below the signal line and the histogram is negative, it indicates a bearish trend. Traders can use this information to align their trades with the prevailing trend.
Signal Line Crossovers:
Another popular method of using MACD is through signal line crossovers. When the MACD line crosses above the signal line, it generates a bullish signal, indicating a potential buying opportunity. Conversely, when the MACD line crosses below the signal line, it generates a bearish signal, indicating a potential selling opportunity. Traders often wait for confirmation from other indicators or price patterns before entering a trade based on these crossovers.
MACD Divergence:
MACD divergence occurs when the MACD indicator diverges from the price action. For example, if the price is making higher highs, but the MACD is making lower highs, it suggests a potential reversal or weakening of the current trend. Traders can use this divergence to anticipate trend reversals and adjust their trading strategies accordingly.
Trading with MACD
While MACD can be used as a standalone indicator, it is often combined with other technical analysis tools to enhance trading decisions. Traders may use additional indicators, such as support and resistance levels, moving averages, or chart patterns, to confirm MACD signals and improve the accuracy of their trades.
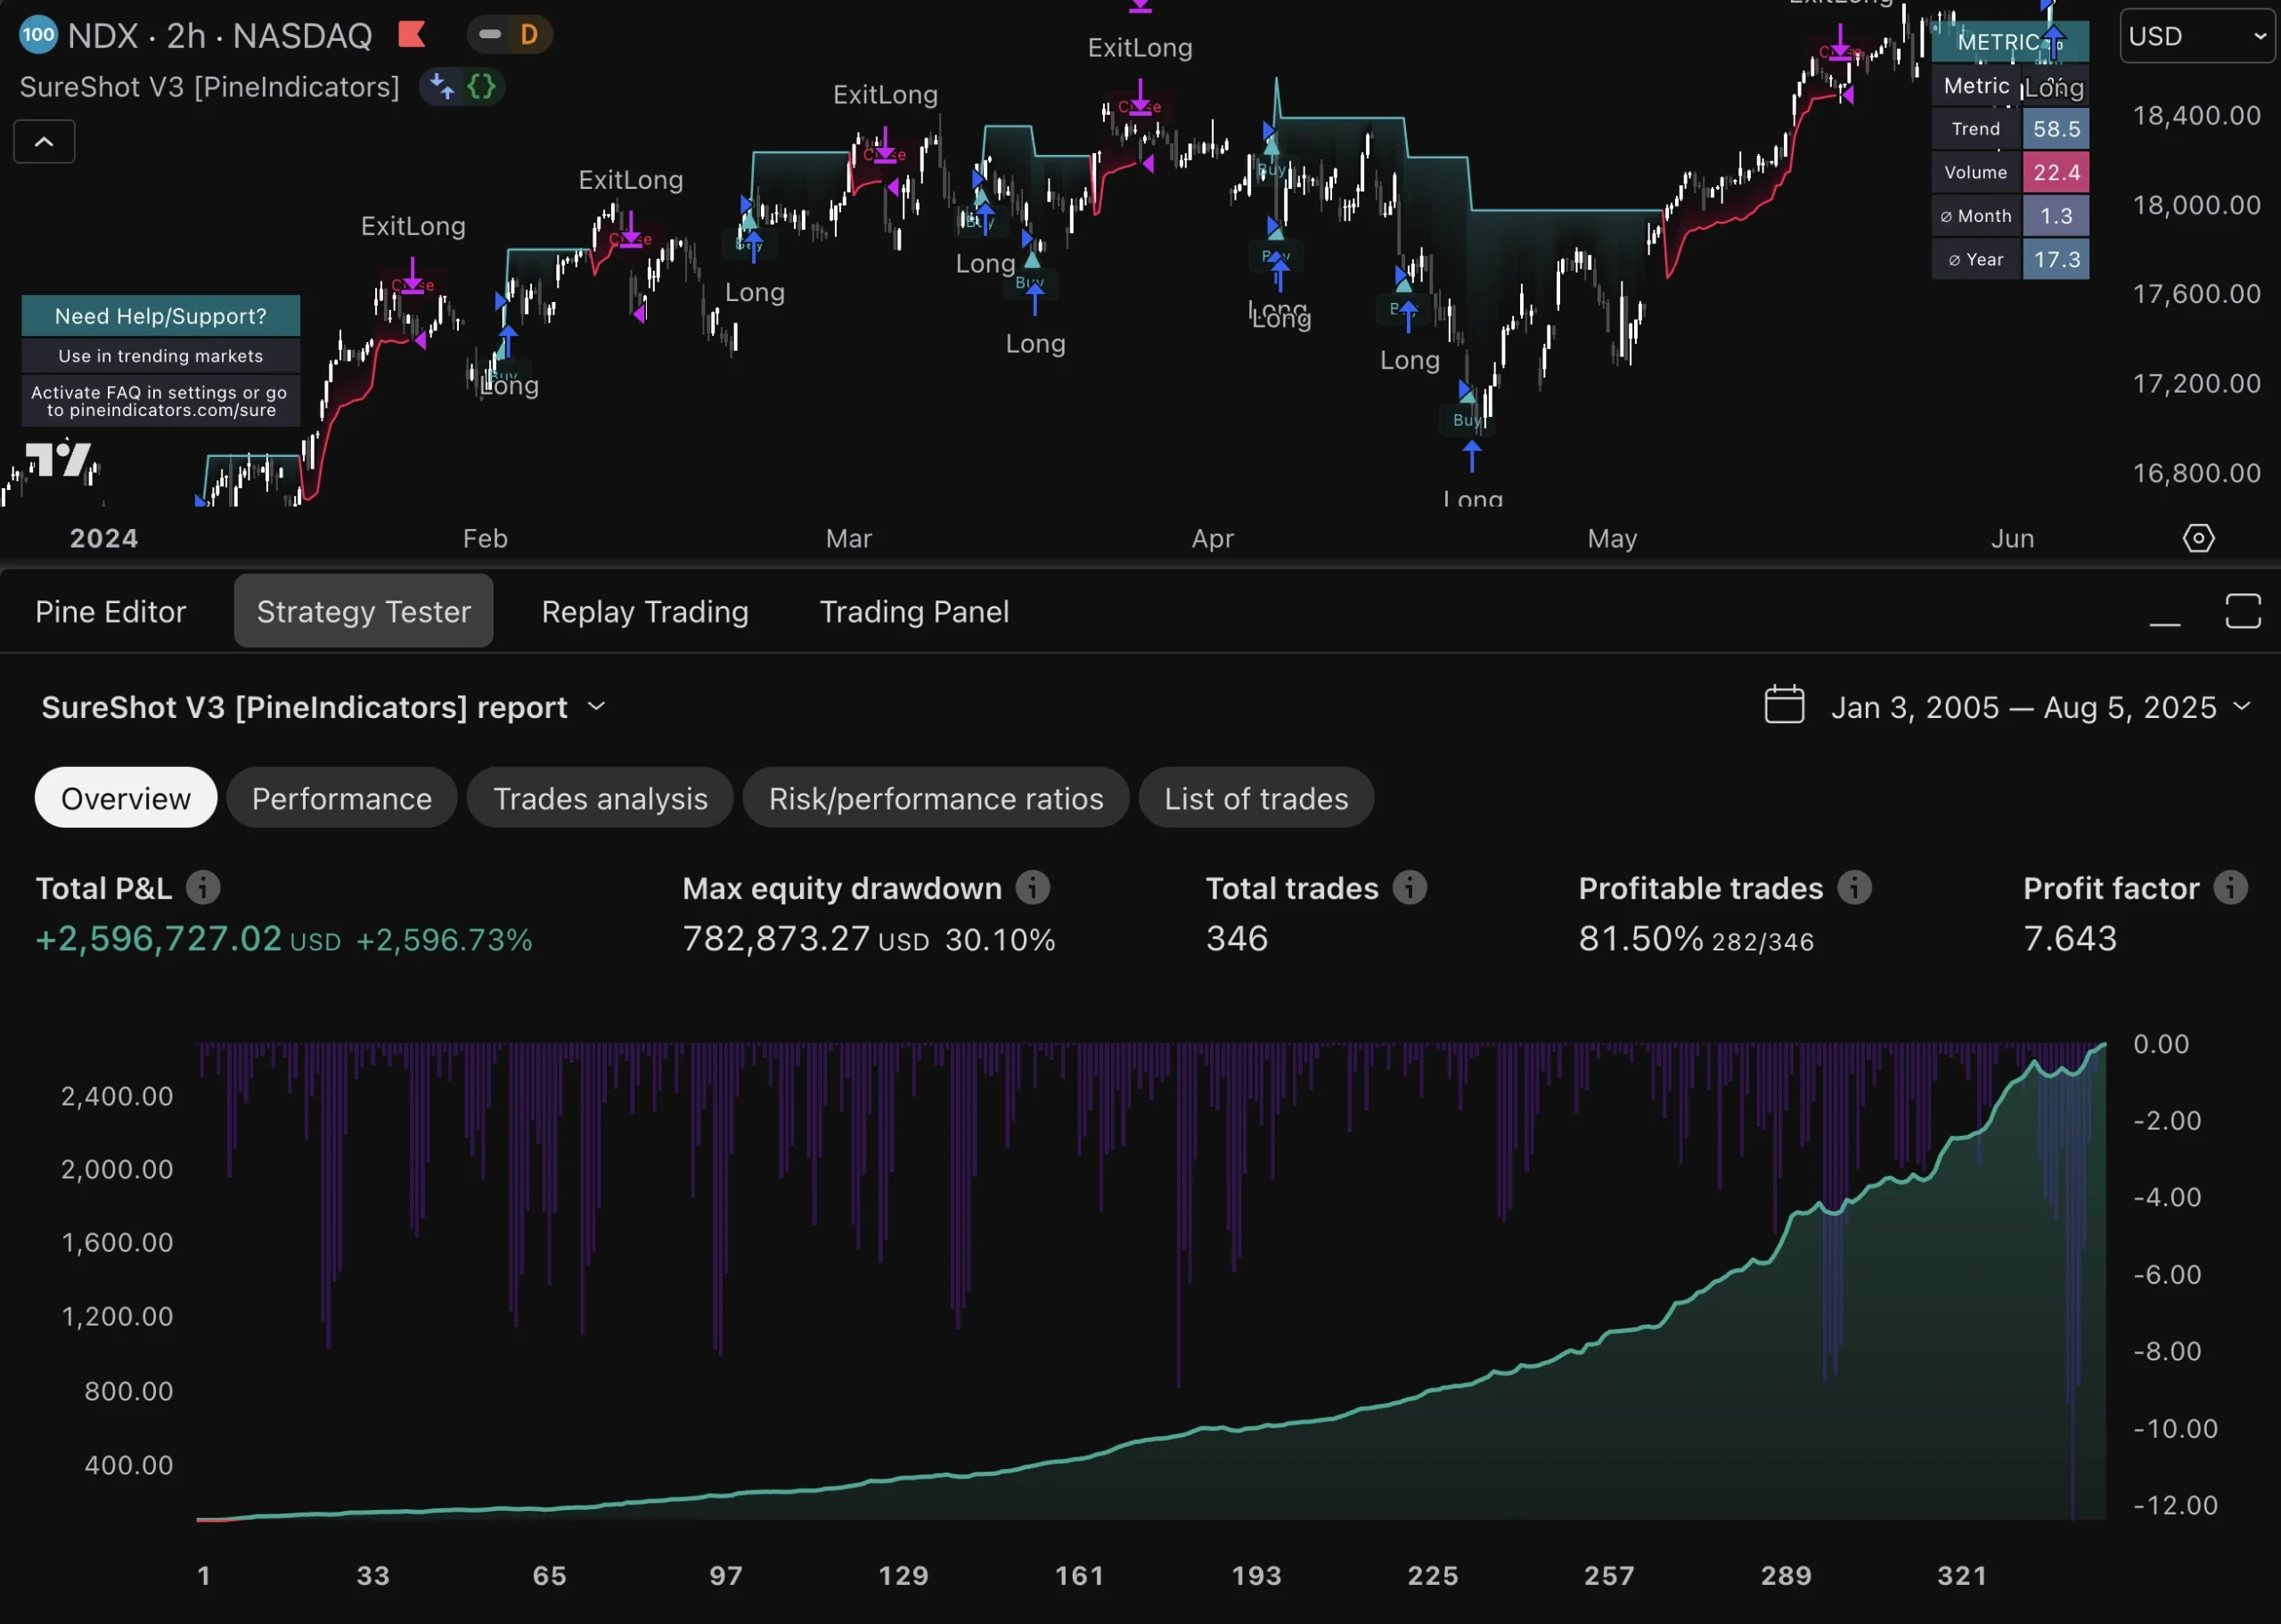
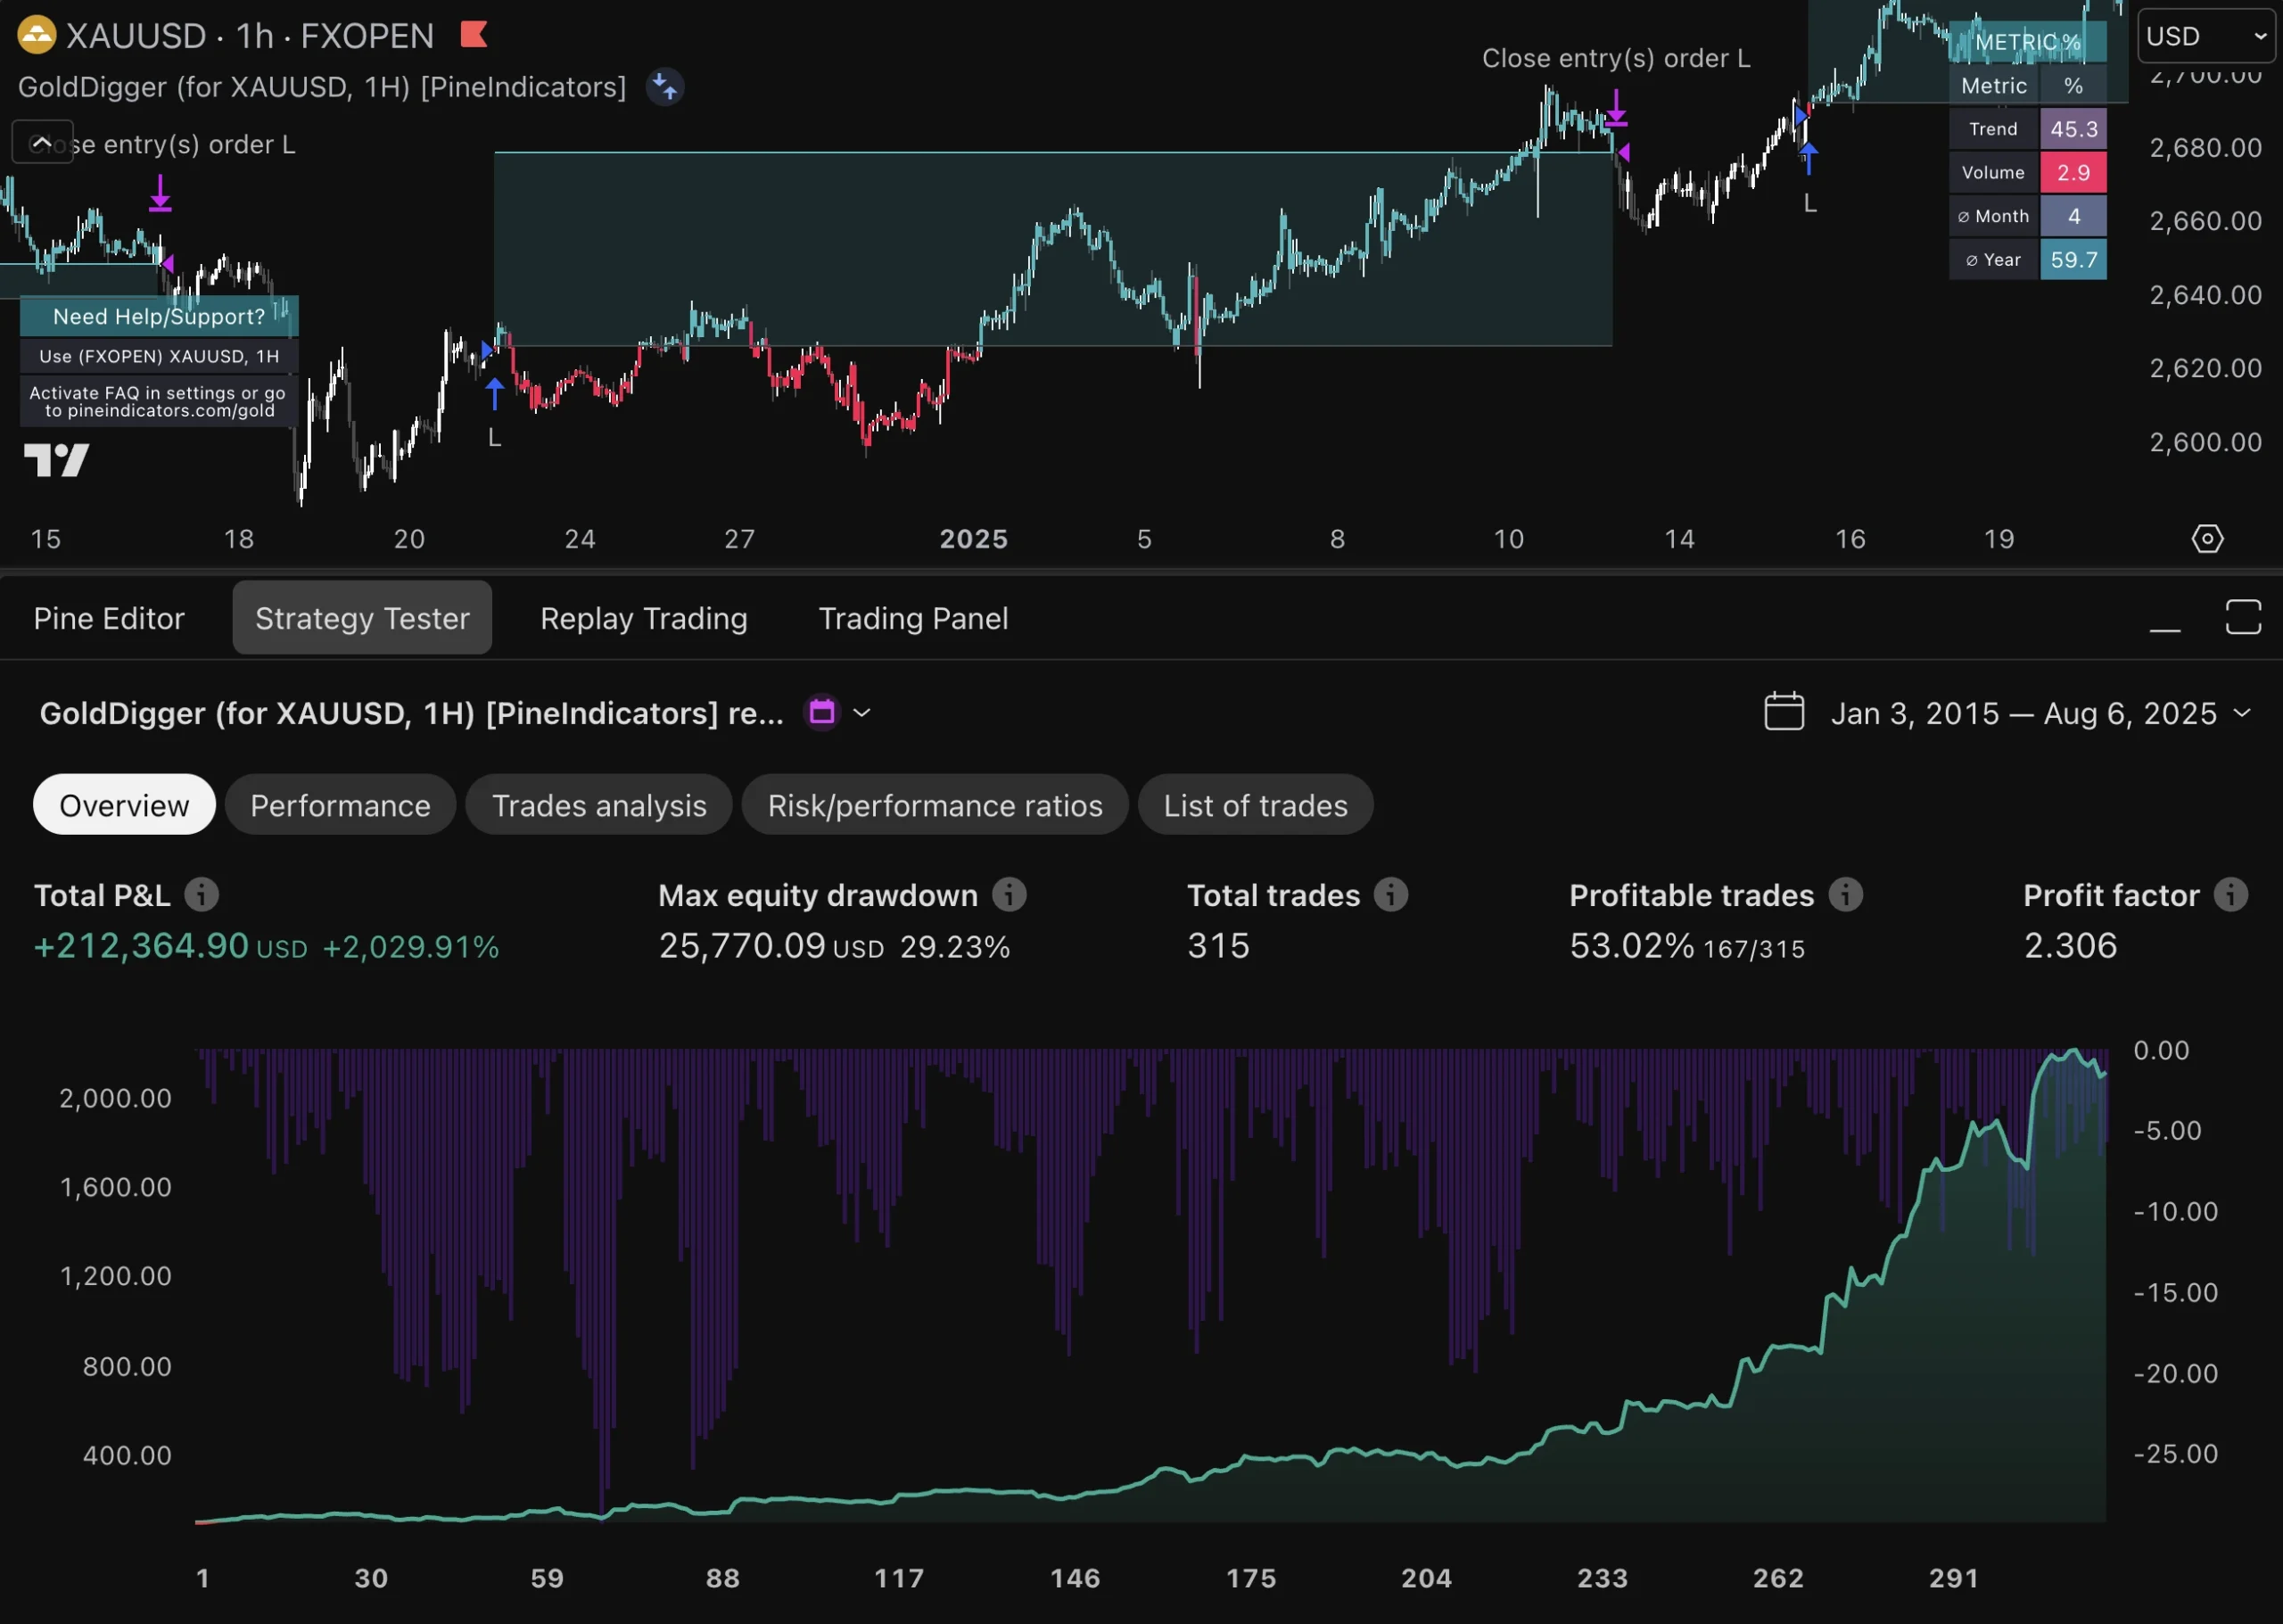
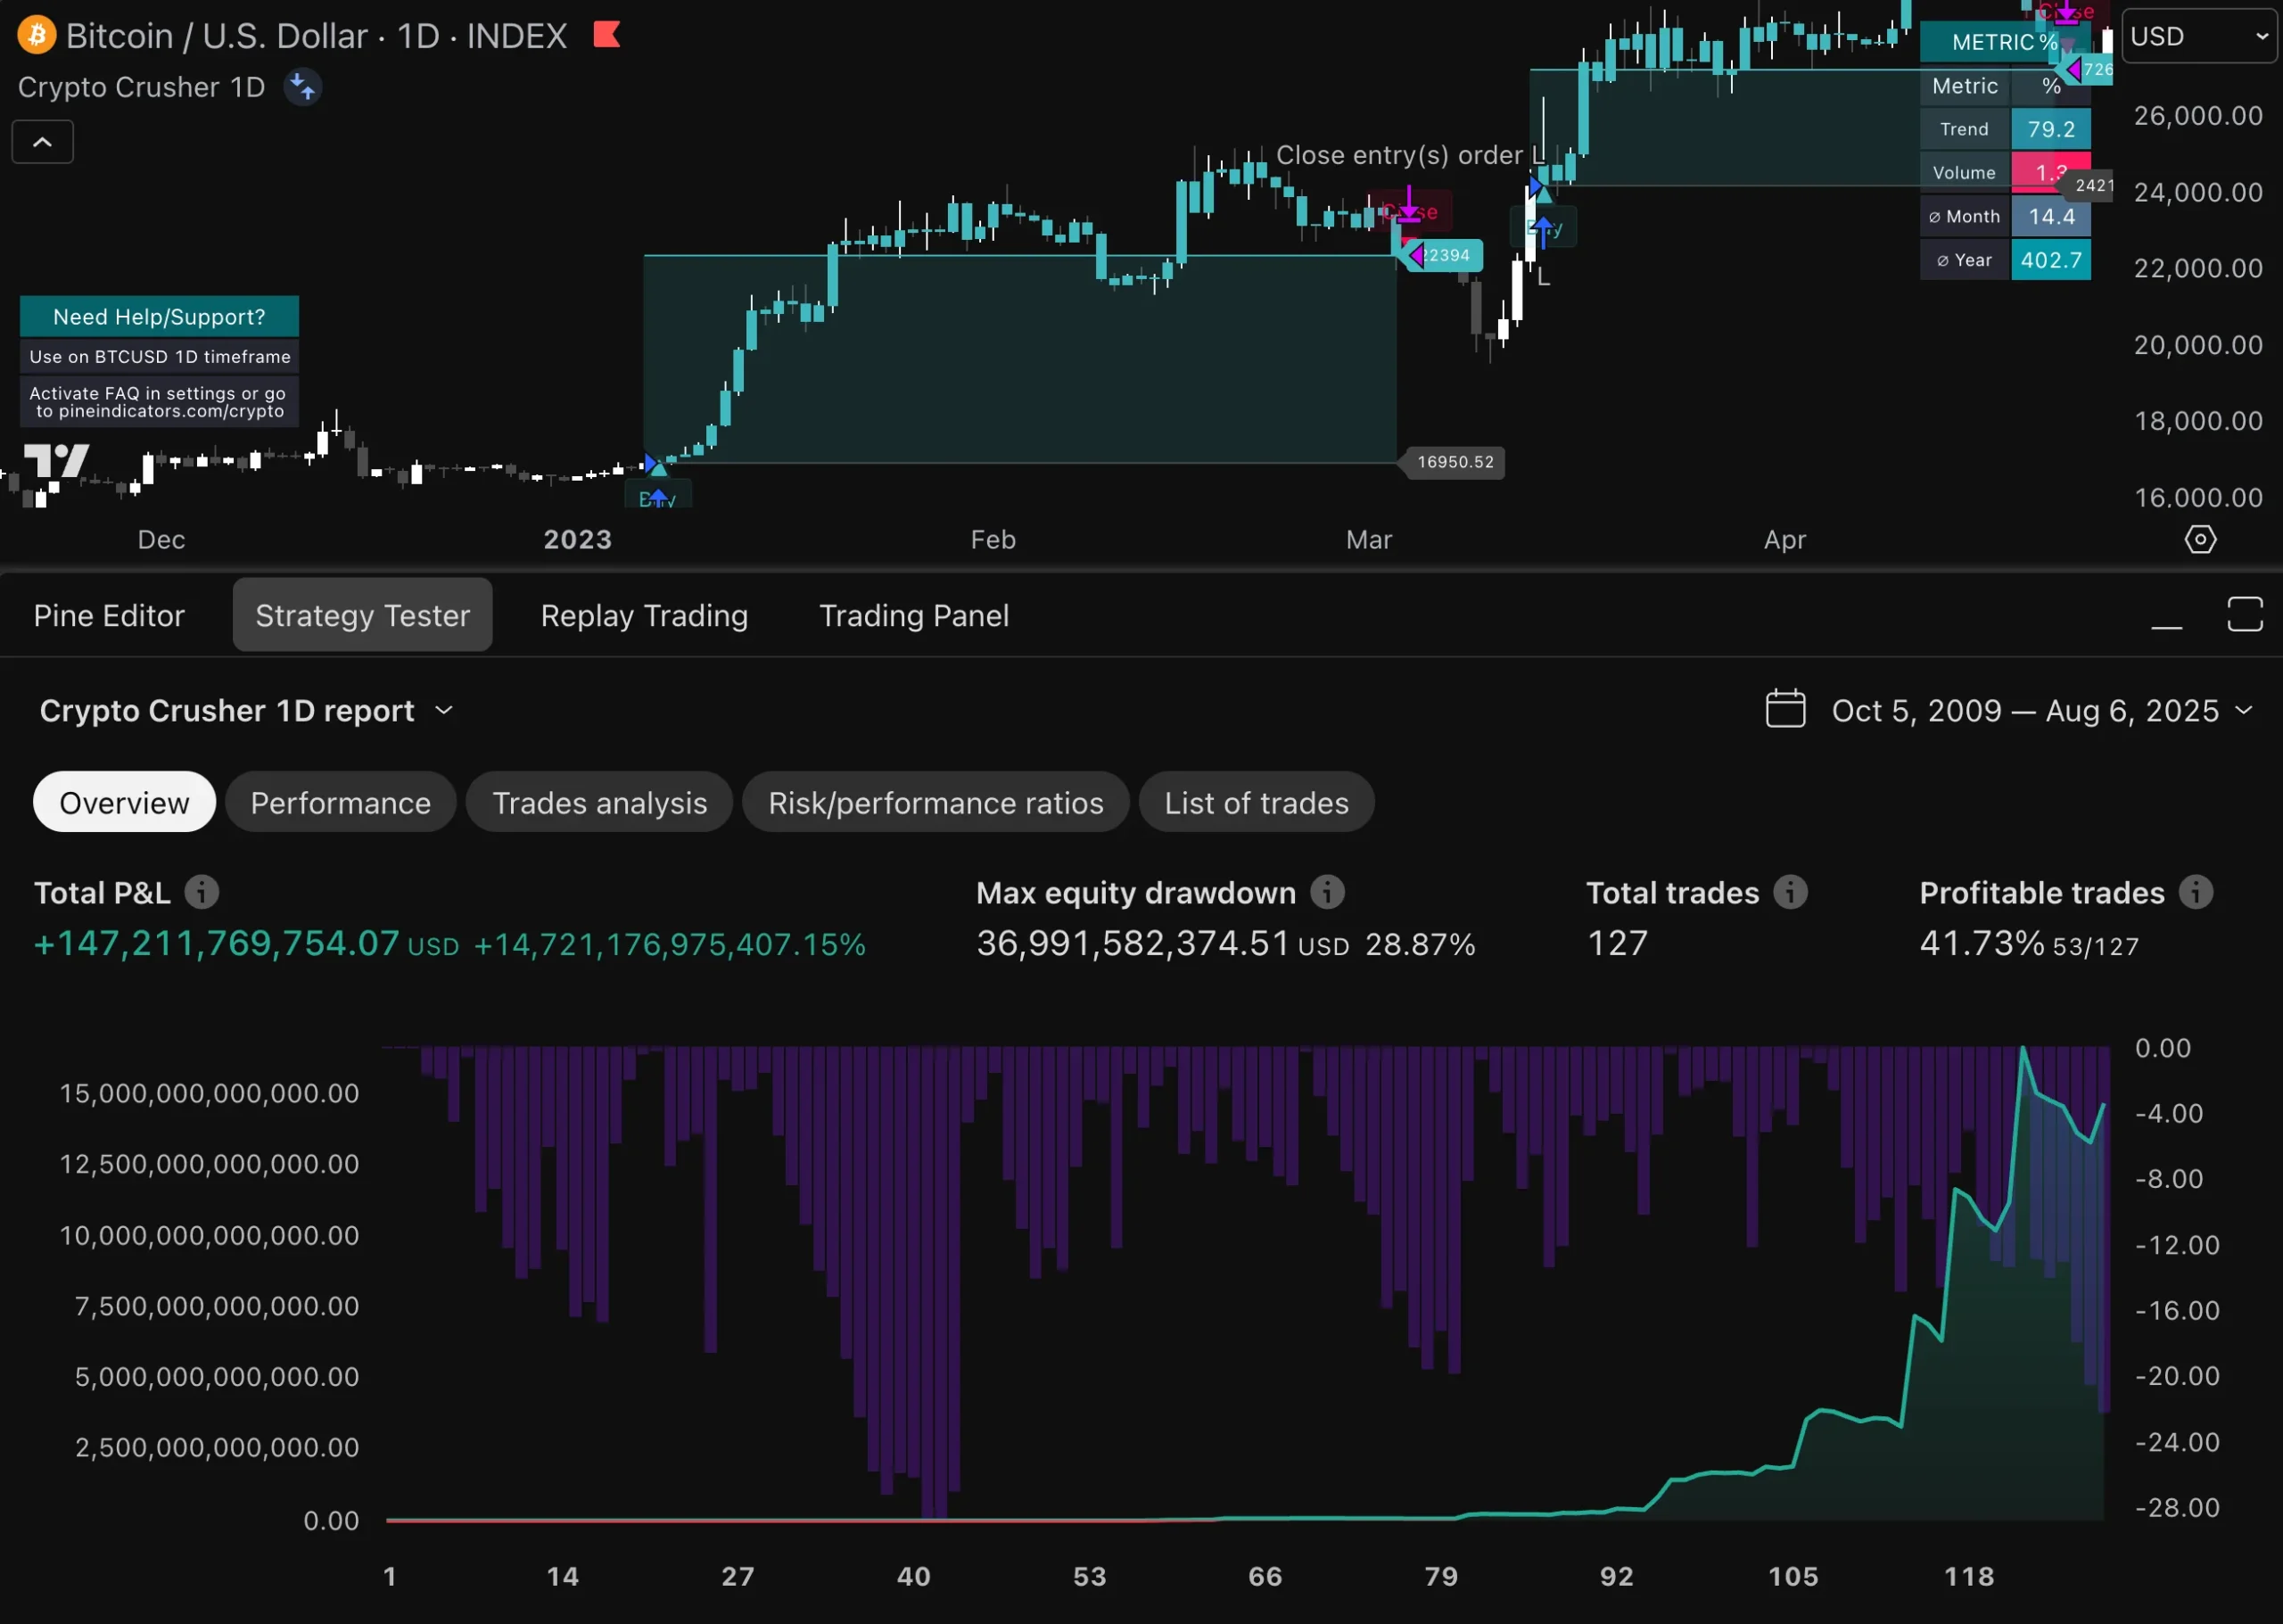
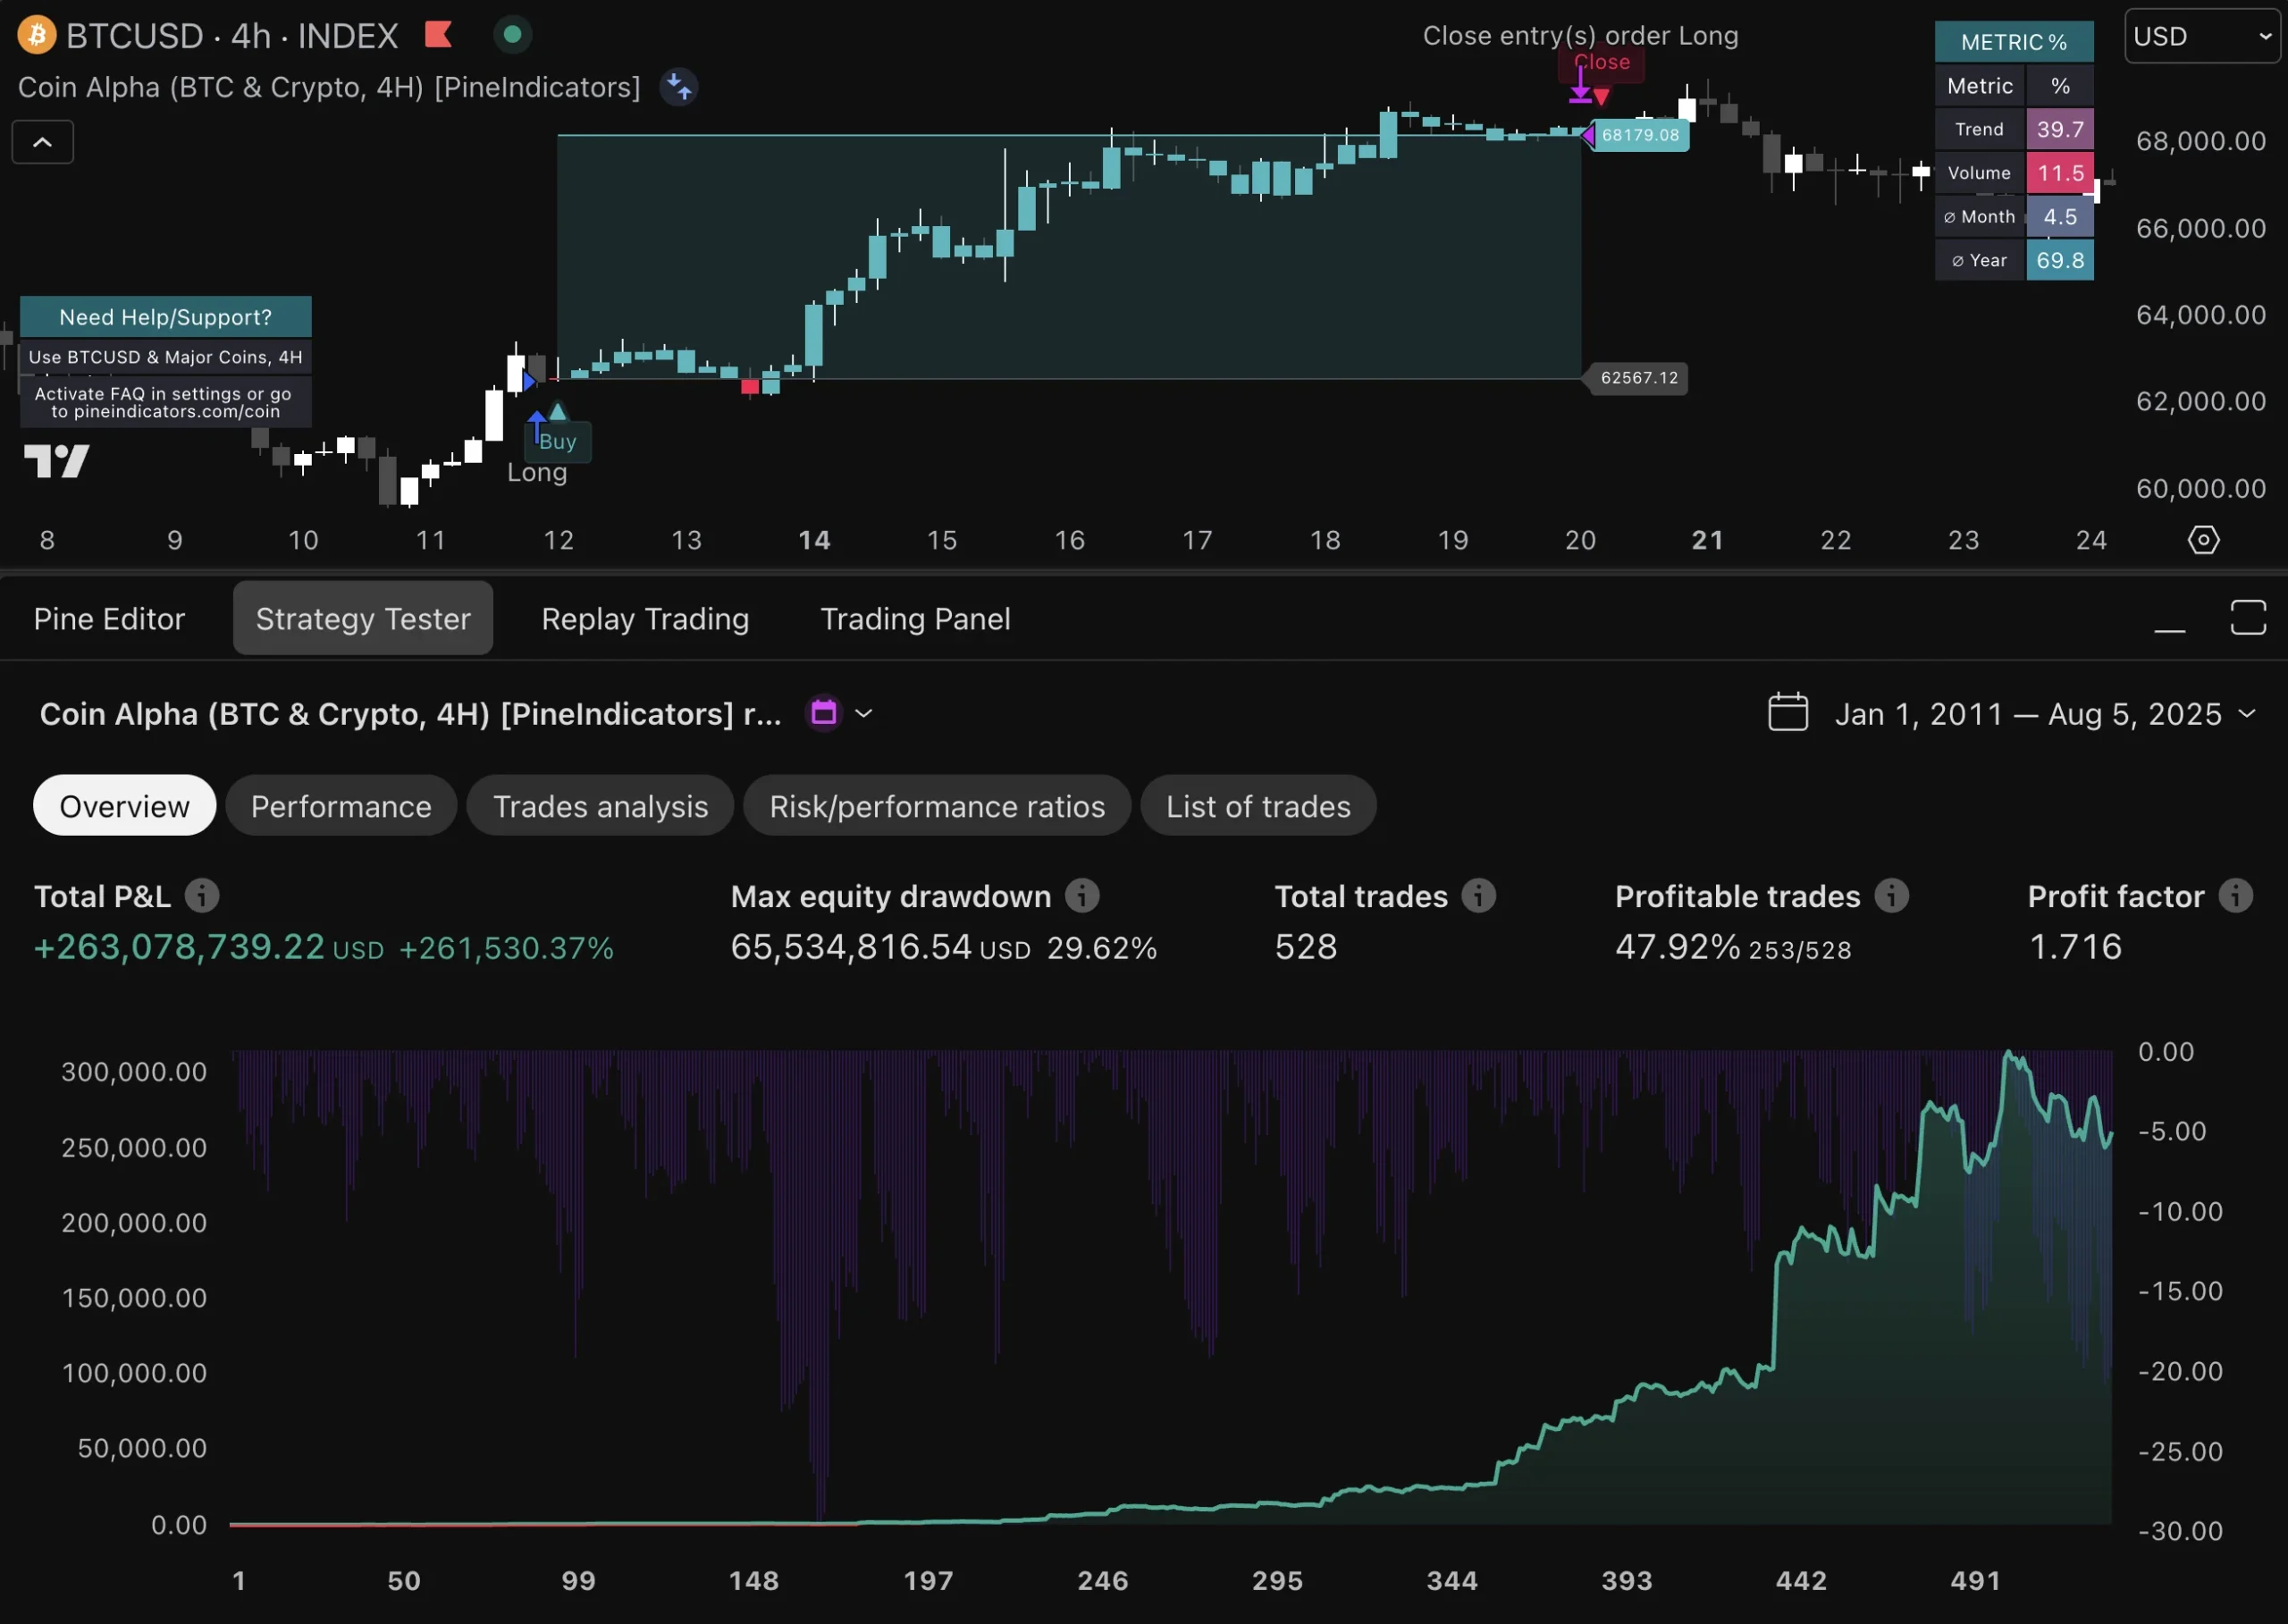
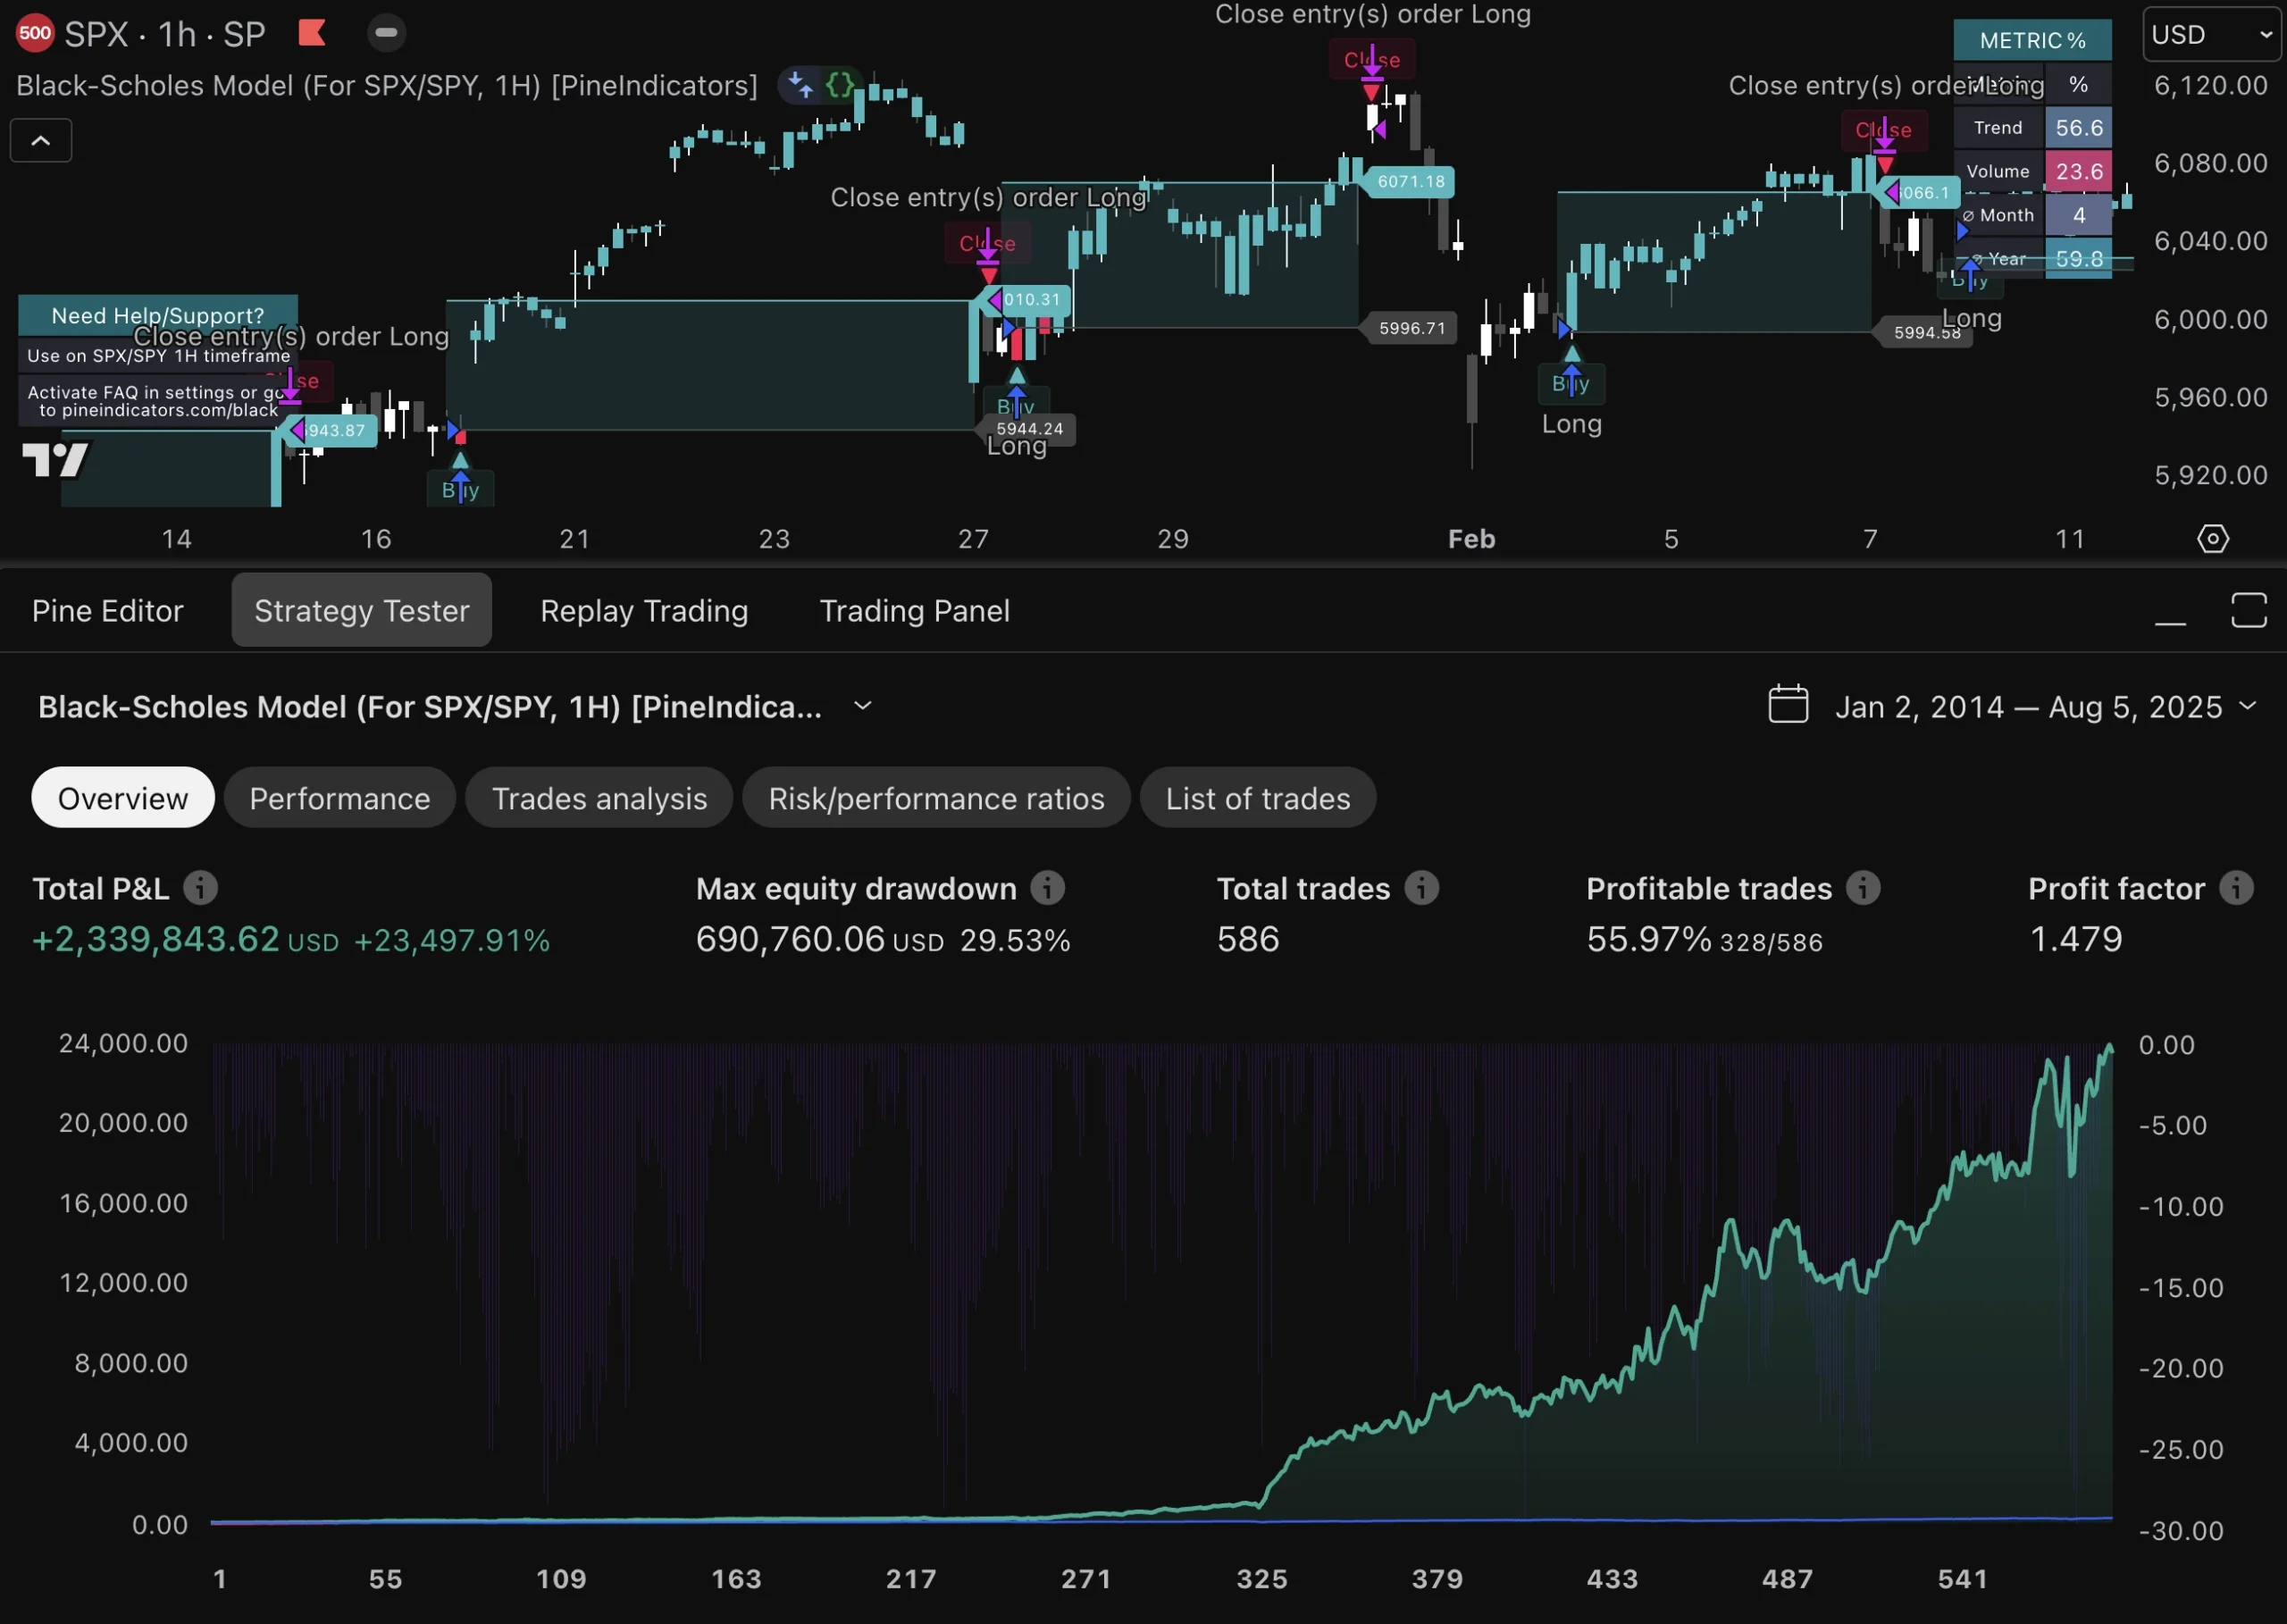
If you are interested in exploring a profitable MACD trading strategy, you can check out our marketplace at PineIndicators.com. We offer a MACD High-Low 80 Strategy for the SPX 45-minute chart, which has a proven win rate of over 80% and is highly profitable. Visit our website to learn more about this strategy and other trading strategies available on our platform.

