Introduction
TradingView is a popular platform among traders, known for its wide range of analytical tools and easy-to-use interface. Whether you’re new to trading or have years of experience, TradingView has a variety of indicators that can help improve your trading strategies. These TradingView indicators are crucial tools that provide visual signals based on different market data, assisting you in making well-informed decisions.
Using the right indicators can greatly enhance your trading results by pinpointing possible buy and sell opportunities. Focusing on past price data and mathematical calculations, these tools can reveal trends, changes in volume, and market situations that might otherwise go unnoticed.
In this article, you’ll learn:
- A detailed explanation of what TradingView indicators are and how they work.
- Different types of indicators available on TradingView.
- How to customize and use these indicators effectively.
- The pros and cons of free vs. paid indicator options.
- Important risk management considerations when using trading indicators.
By the end, you’ll have a comprehensive understanding of how to buy TradingView indicators and integrate them into your trading strategies for maximum potential.
Understanding TradingView Indicators
TradingView indicators are essential tools for market analysis, designed to help traders interpret market data and make informed decisions. These indicators analyze historical price movements and other market dynamics to provide visual signals, making it easier to spot trading opportunities.
What Are TradingView Indicators?
TradingView indicators are algorithmic tools that apply mathematical formulas to historical price data. Their main purpose is to generate signals indicating potential buy or sell opportunities. By evaluating past market behavior, these indicators aim to forecast future price movements.
How Do Indicators Help Traders?
Indicators serve as a decision-support system for traders. They:
- Analyze historical data to identify trends and patterns.
- Generate actionable signals based on predefined criteria.
- Help in validating trading strategies by providing real-time feedback.
For example, a Moving Average indicator can smooth out price data to identify the prevailing trend, while the Relative Strength Index (RSI) can highlight overbought or oversold conditions.
Why Are Visual Signals Important?
Visual signals are graphical representations of market data processed by indicators. These signals simplify complex data sets into easily interpretable formats such as:
- Arrows indicating buy or sell points.
- Colored lines representing different trends.
- Histograms showing volume changes.
Visual signals help traders quickly grasp market conditions without delving into raw data, enabling faster decision-making and more efficient trading strategies.
TradingView’s array of indicators offers valuable insights into market behavior, making them indispensable for both novice and experienced traders.
Types of TradingView Indicators
1. Buy-Sell Indicators
Buy-sell indicators are essential tools for traders. They generate signals that suggest when to enter or exit the market, helping you make better trading decisions.
Examples of Buy-Sell Indicators:
- Simple Moving Average (SMA): This indicator calculates the average price over a specific period, generating buy or sell signals when the asset’s price crosses above or below the moving average.
- Relative Strength Index (RSI): RSI measures the speed and change of price movements, typically used to identify overbought or oversold conditions, signaling potential buy or sell opportunities.
Edri Extreme Points Indicator:
One of the standout buy-sell indicators on TradingView is the Edri Extreme Points indicator. This tool combines multiple technical analysis methods to provide robust buy and sell signals. Here’s how it works:
- Commodity Channel Index (CCI): CCI measures the current price level relative to an average price over a specified period.
- Momentum: This component evaluates the rate of change in asset prices, helping to identify potential reversals.
- Relative Strength Index (RSI): As mentioned earlier, RSI helps detect overbought or oversold conditions.
The Edri Extreme Points indicator synthesizes these elements to identify extreme points where prices might reverse. By combining CCI, Momentum, and RSI, this indicator aims to provide more accurate and timely signals.
How These Indicators Help Identify Potential Reversals:
Buy-sell indicators like the Edri Extreme Points are particularly useful for spotting potential market reversals. For instance:
- When the RSI indicates an overbought condition while CCI shows a high value, it may signal that a price drop is imminent.
- Conversely, an oversold RSI combined with a low CCI could indicate an upcoming price increase.
These indicators offer valuable insights into market dynamics, making them indispensable tools for traders seeking to optimize their strategies.
2. Trend Indicators
Trend indicators are crucial in trading because they help identify the overall direction of the market. By understanding market trends, you can align your trades with current conditions, increasing the likelihood of success.
Common trend indicators on TradingView include:
- Moving Averages (MA): These smooth out price data to help you see the underlying trend. Examples include Simple Moving Average (SMA) and Exponential Moving Average (EMA).
- Bollinger Bands: These consist of a middle band (an MA) and two outer bands that measure volatility. They can indicate overbought or oversold conditions.
- Average Directional Index (ADX): This indicator measures the strength of a trend, helping to determine whether the market is trending or ranging.
Aligning trades with market conditions involves understanding when a market is trending upwards, downwards, or sideways. For instance:
- During an uptrend, look for opportunities to buy as prices continue to rise.
- In a downtrend, consider selling or shorting as prices fall.
- When the market is sideways, avoid large positions and focus on short-term trades.
Using trend indicators effectively requires practice and a solid understanding of how they work. Combining them with other tools like volume analysis or buy-sell signals from indicators such as the Edri Extreme Points indicator can provide more robust trading strategies.
By integrating these tools into your trading arsenal, you enhance your ability to make informed decisions based on market trends.
3. Volume Indicators
Volume analysis plays a critical role in making informed trading decisions. By examining the volume of trades, you can gain insights into buying and selling pressure, which helps in understanding market sentiment.
Popular volume indicators on TradingView include:
- Volume Profile: This tool displays traded volume at specific price levels, highlighting areas of high activity.
- On-Balance Volume (OBV): OBV combines price movement and volume to predict price changes. A rising OBV suggests buying pressure, while a falling OBV indicates selling pressure.
- Volume Weighted Average Price (VWAP): VWAP calculates the average price a security has traded at throughout the day, based on both volume and price. It helps traders gauge whether the current price is fair relative to the day’s trading activity.
When analyzing buying and selling pressure through volume data, these indicators provide valuable information:
For instance, a spike in volume with a corresponding upward price movement may indicate strong buying interest, while decreasing volume during a downtrend could suggest weakening selling pressure.
Understanding volume dynamics can complement other indicators like the Edri Extreme Points indicator, CCI indicator, and RSI indicator. Integrating these tools with volume indicators enables you to develop well-rounded trading strategies, enhancing your ability to generate accurate buy-sell signals and identify trends effectively.
How TradingView Indicators Work and How You Can Customize Them
TradingView indicators are powerful tools that provide traders with actionable insights. They achieve this by analyzing historical price data, applying mathematical formulas, and generating signals that can guide trading decisions.
Analyzing Past Market Behavior
TradingView indicators operate by examining past market behavior to predict future movements. This process involves:
- Data Collection: Indicators gather extensive historical price data, including opening, closing, high, and low prices.
- Data Processing: The collected data is processed to identify patterns or trends that could indicate future price movements.
- Signal Generation: Based on the identified patterns, indicators generate buy or sell signals.
This method of technical analysis is essential for making informed trading decisions.
Using Mathematical Formulas
Indicators rely on various mathematical formulas to transform raw market data into useful trading signals. Some common examples include:
- Moving Averages (MA): Simple Moving Average (SMA) and Exponential Moving Average (EMA) calculate the average price over a specific period to smooth out short-term fluctuations.
- Relative Strength Index (RSI): Measures the speed and change of price movements to identify overbought or oversold conditions.
- Bollinger Bands: Uses standard deviation to plot bands above and below a moving average, indicating volatility levels.
These formulas help traders interpret complex market data more easily, making it simpler to recognize potential trading opportunities.
Customizing Your Indicators
One key advantage of TradingView indicators is their customization capability. Traders can tailor indicators to fit their specific strategies by adjusting parameters such as:
- Timeframes: Modify the period over which data is analyzed. For instance, you can set a moving average to a 20-day period instead of a 50-day period.
- Threshold Levels: Customize overbought/oversold levels in oscillators like RSI or Stochastic.
- Alert Settings: Set custom alerts based on specific indicator conditions. For example, get notified when the RSI crosses above 70.
These customization options allow traders to fine-tune indicators according to their unique trading styles and risk tolerances. To enhance your strategy, exploring both free and paid options could be beneficial when you decide to buy TradingView indicators.
Using these features effectively can significantly improve your ability to make informed trading decisions based on precise market analysis.
Purchasing TradingView Indicators: Free vs. Paid Options
Choosing between free indicators and paid indicators on TradingView can significantly impact your trading experience. Understanding the differences, benefits, and potential drawbacks of each option is crucial for making an informed decision.
Free Indicators
Advantages:
- Cost-effective: No financial investment required.
- Wide variety: A large selection of indicators created by the TradingView community.
- Transparency: Open-source scripts allow you to see and understand the underlying logic.
Disadvantages:
- Basic features: Often lack advanced functionalities.
- Limited support: Community-based support, which may not be as reliable or prompt.
- Variable quality: Quality can vary widely since anyone can publish an indicator.
Paid Indicators
Advantages:
- Advanced features: Often include proprietary algorithms and additional functionalities.
- Professional support: Direct access to developer support for troubleshooting and guidance.
- Higher reliability: Typically developed by experienced traders or professionals.
Disadvantages:
- Cost: Requires a financial investment, which might not be feasible for all traders.
- Closed-source: Proprietary algorithms mean you can’t inspect the code behind the indicator.
Evaluating Indicator Value
When considering purchasing an indicator, it’s essential to evaluate its value based on specific criteria:
- Reputation of the Developer: Assess the trustworthiness and expertise of the developer. Look for reviews, ratings, and user feedback.
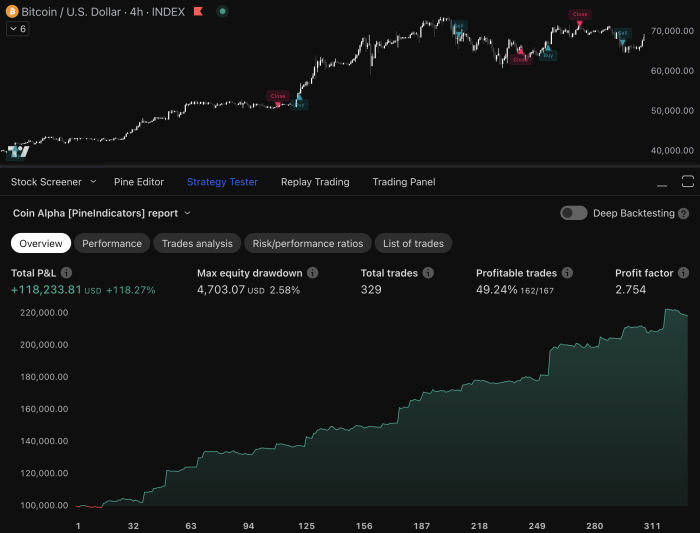
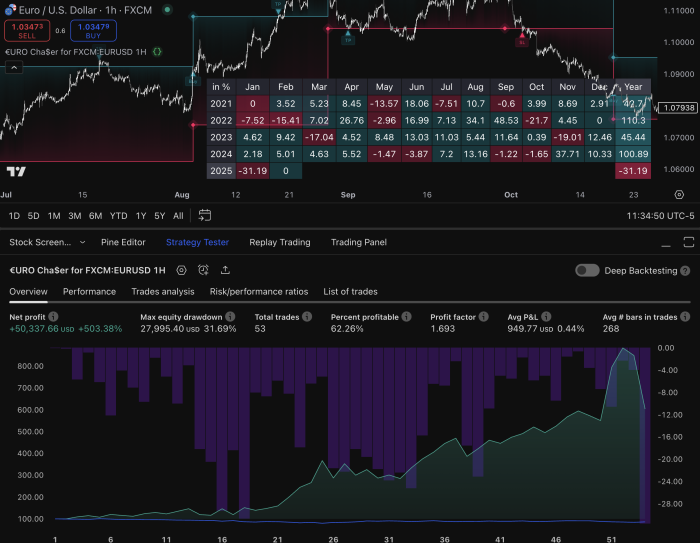
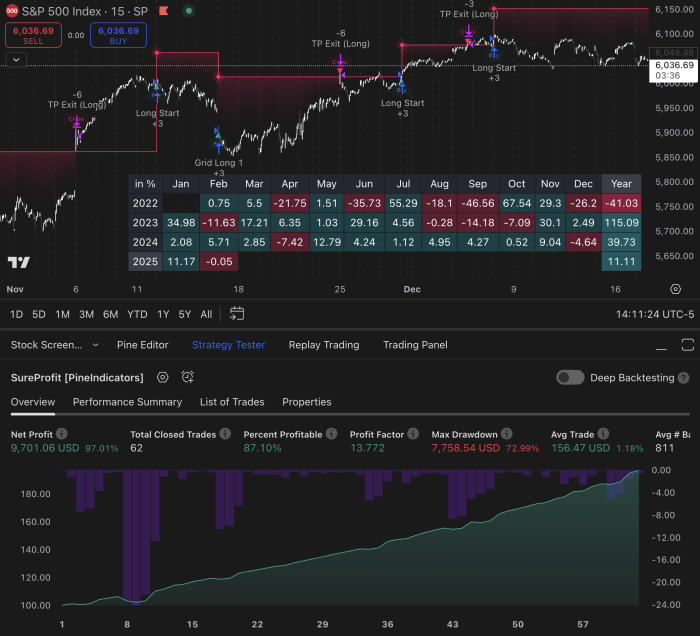
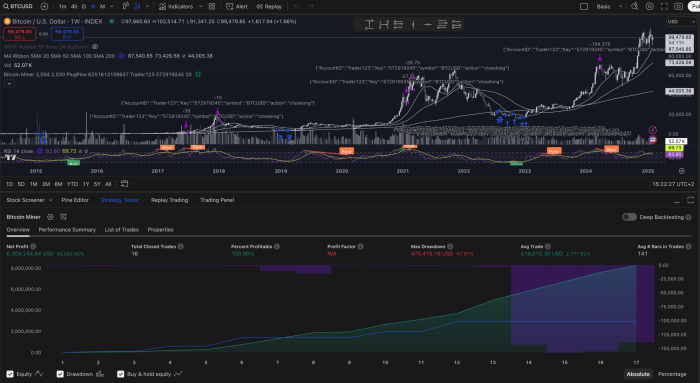
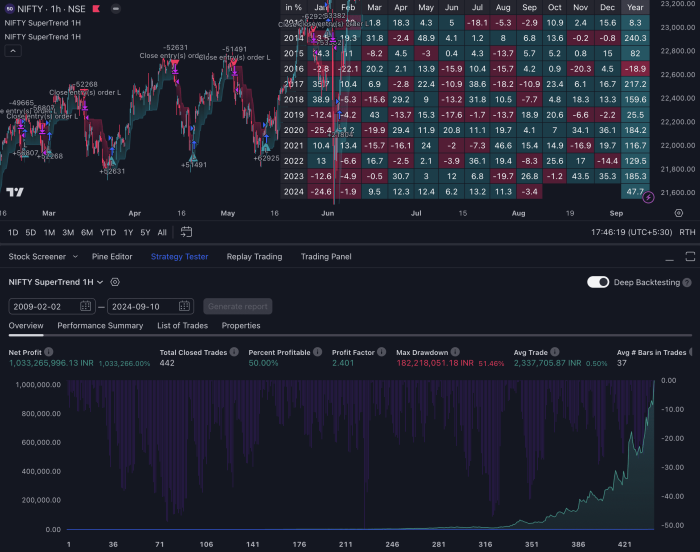
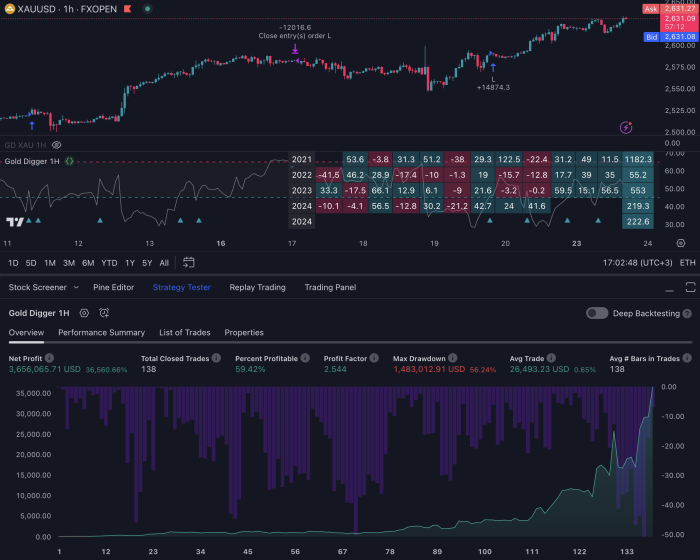
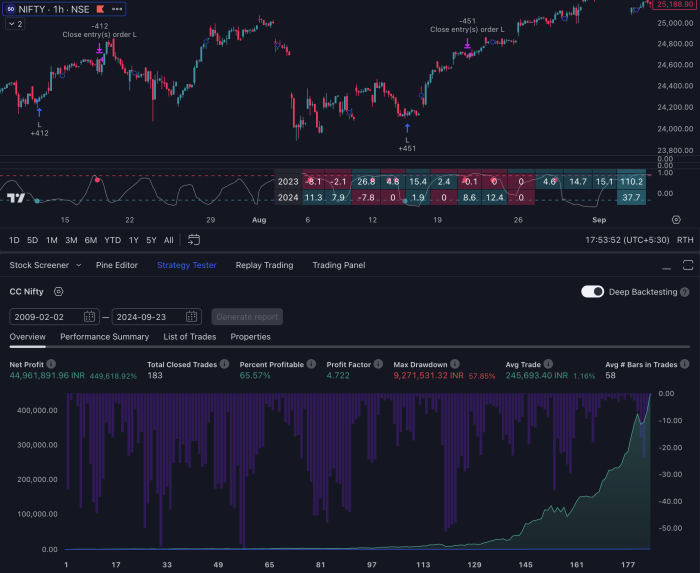
- Performance Metrics: Examine backtesting results and historical performance data if available. Check how well the indicator has performed in various market conditions.
- Feature Set: Compare features with other similar indicators. Ensure it offers unique functionalities that justify its cost.
- Customization Options: Determine if the indicator allows for customization to suit your trading strategy and preferences.
- Support and Updates: Consider the level of customer support provided and whether regular updates are released to improve functionality or adapt to market changes.
By carefully weighing these factors, you can make an informed decision about whether a free or paid TradingView indicator better aligns with your trading goals and strategies.
Risk Management Considerations When Using Trading Indicators
Effective risk management strategies for trading indicators are essential in safeguarding your trading capital. Utilizing tools like stop-loss orders and position sizing techniques can mitigate potential losses.
Key Strategies:
- Stop-Loss Orders: Automatically sell a security when it reaches a predetermined price, limiting the amount of loss on a trade. This ensures you don’t hold onto losing positions longer than necessary.
- Position Sizing: Determines the amount of capital allocated to a specific trade, based on the risk associated with that trade. By limiting exposure, you protect your portfolio from significant losses.
Why It Matters:
- Emotional Control: Prevents panic selling and impulsive decisions during market volatility.
- Consistency: Helps maintain a disciplined approach, ensuring long-term profitability.
Utilizing these strategies alongside your TradingView indicators enhances your ability to make informed, calculated trading decisions while minimizing risk.
Conclusion: Maximizing Your Trading Potential with the Right Indicators on TradingView
Exploring both free and paid options on TradingView can significantly enhance your trading strategies. While free indicators provide a solid foundation, paid indicators often come with advanced features that can offer additional insights.
Remember the importance of risk management. Using tools like stop-loss orders and position sizing techniques ensures you manage potential downsides effectively.
Key Takeaways:
- Explore Both Options: Utilize free indicators to understand their basics, then consider purchasing advanced ones for more sophisticated strategies.
- Prioritize Risk Management: Incorporate robust risk management practices regardless of the indicators you use.
By balancing between free and paid indicators while maintaining a strong focus on risk management, you can maximize your trading potential on TradingView.
FAQs (Frequently Asked Questions)
What are TradingView indicators and why are they important?
TradingView indicators are tools that help traders analyze market data and make informed trading decisions. They provide visual signals that can significantly enhance trading strategies by identifying trends, potential reversals, and market conditions.
What types of TradingView indicators can I use?
There are several types of TradingView indicators, including buy-sell indicators like the Edri Extreme Points indicator, trend indicators for identifying market trends, and volume indicators that analyze buying and selling pressure. Each type serves a specific purpose in enhancing trading strategies.
How do I customize TradingView indicators?
TradingView allows users to customize indicators by adjusting parameters based on historical price data analysis. This includes changing settings to fit individual trading styles and preferences, as well as utilizing mathematical formulas used in indicator calculations.
Should I choose free or paid TradingView indicators?
Choosing between free and paid TradingView indicators depends on your trading needs. Free indicators can be useful for beginners, but paid options often offer advanced features and more reliable signals. It’s essential to evaluate the value of purchased indicators based on their effectiveness in your trading strategy.
What risk management strategies should I consider when using trading indicators?
Risk management is crucial when using trading indicators. Strategies such as implementing stop-loss orders and position sizing techniques can help mitigate losses and protect your capital. Prioritizing risk management ensures that your trading approach remains sustainable over time.
How can I maximize my trading potential with TradingView indicators?
To maximize your trading potential, explore both free and paid TradingView indicators while focusing on those that align with your trading goals. Additionally, prioritize risk management practices to safeguard your investments and enhance overall performance in the market.

