Introduction
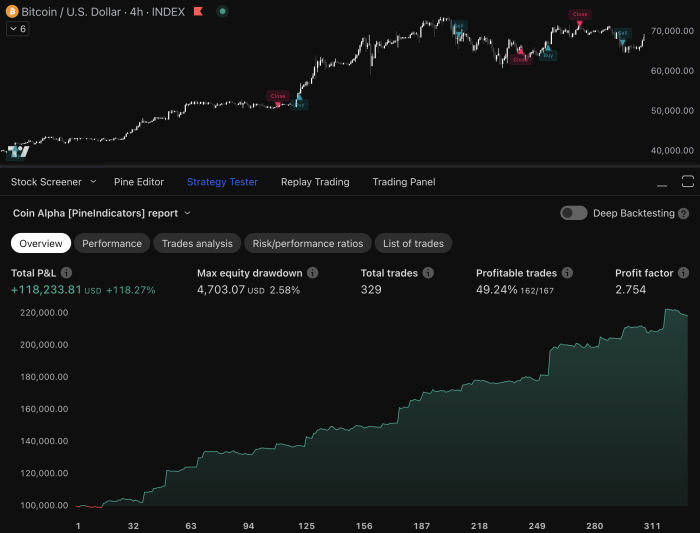
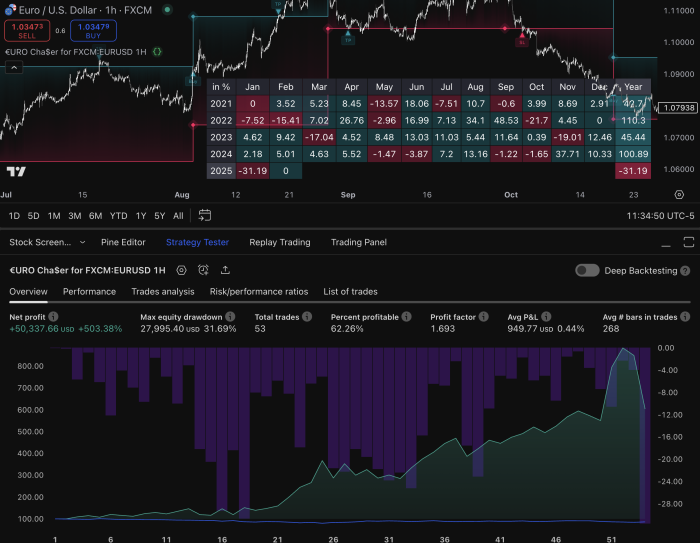
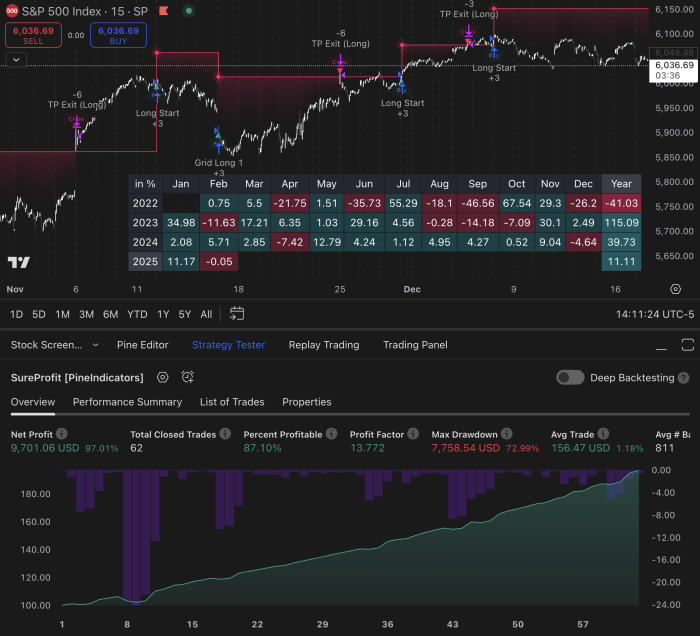
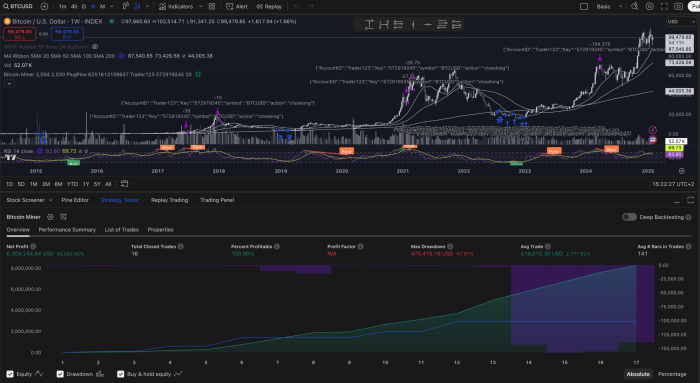
High-profit trading strategies can significantly enhance your trading portfolio by generating substantial returns within short periods. These strategies often leverage a combination of technical indicators and market conditions to maximize profitability. TradingView, a leading charting platform, serves as an essential tool for traders to access and effectively utilize these high-profit trading strategies.
Why TradingView is Important
- Accessibility: TradingView provides a user-friendly interface that allows traders to easily implement and customize various high-profit trading strategies.
- Community: The platform boasts an active community of experienced traders who share their insights and strategies, enabling you to learn and adapt quickly.
How Technical Indicators Help
Technical indicators play a crucial role in enhancing the accuracy and reliability of trading signals. By incorporating indicators such as Moving Averages, MACD, RSI, and ATR, you can better identify entry and exit points, thus optimizing your trades’ success rates. These tools help in:
- Identifying Trends: Detecting market trends early can lead to more profitable trades.
- Signal Confirmation: Multiple indicators can confirm trading signals, reducing the risk of false entries.
TradingView’s integration of these technical indicators makes it an indispensable resource for anyone looking to capitalize on high-profit trading strategies.
Understanding High-Profit Trading Strategies
What Are High-Profit Trading Strategies?
High-profit trading strategies are methods used by traders to take advantage of market opportunities and make significant profits in a short period of time. These strategies usually involve using technical analysis, which means studying charts and patterns to make informed decisions. Here are some key features of high-profit trading strategies:
- Aggressive Entry and Exit Points: It’s important to identify the right times to enter and exit trades quickly.
- Use of Leverage: This means borrowing money to increase potential profits, but it also increases the risk of losing money.
- High Accuracy Indicators: These strategies rely on indicators that have a high success rate in predicting price movements.
What Affects the Profit Potential?
There are several factors that can influence how effective high-profit trading strategies are:
- Market Volatility: When prices are moving up and down rapidly, there are more opportunities for making big profits.
- Liquidity: This refers to how easily you can buy or sell an asset without causing a significant change in its price.
- Timing: Being able to enter and exit trades at the right time is crucial for maximizing profits.
How Can You Adapt to Different Market Conditions?
To improve the performance of high-profit trading strategies, it’s important to adapt them to different market conditions. Here are some examples of how you can adjust your strategy based on the current market environment:
- In volatile markets, where prices are fluctuating greatly, using indicators like the Average True Range (ATR) can help manage risk.
- During trending periods, when prices are consistently moving in one direction, moving average crossovers can be effective in signaling when to enter or exit trades.
- In sideways markets, where prices are staying within a certain range, support and resistance levels become important for identifying potential trading opportunities.
By understanding these elements, you will be better equipped to use high-profit trading strategies effectively on platforms like TradingView.
Popular High-Profit Trading Strategies on TradingView
1. IMRv1.0 Strategy: A Deep Dive into ZLEMA and No Lag MACD Indicators
Understanding the IMRv1.0 Strategy
The IMRv1.0 Strategy is designed for long trades, focusing on indicators like Zero Lag Exponential Moving Average (ZLEMA) and No Lag Moving Average Convergence Divergence (No Lag MACD). This strategy aims to achieve a high accuracy rate, often surpassing 70%, by using these advanced technical indicators.
Key Components of the IMRv1.0 Strategy
- ZLEMA: This indicator reduces lag by accounting for price changes more effectively than traditional EMAs. It makes the IMRv1.0 Strategy responsive to price movements.
- No Lag MACD: Enhances the traditional MACD by minimizing lag, providing more timely signals for entry and exit points.
How to Implement IMRv1.0 Strategy on TradingView
Implementing the IMRv1.0 Strategy on TradingView is straightforward:
- Setup Your Chart:
- Go to TradingView and select your preferred asset (e.g., BTCUSD).
- Choose an appropriate timeframe that aligns with your trading goals.
- Add Indicators:
- Navigate to the ‘Indicators’ tab.
- Search for ‘ZLEMA’ and add it to your chart.
- Repeat the process for ‘No Lag MACD’.
- Configure Indicator Settings:
- Adjust ZLEMA settings based on your risk tolerance and market conditions.
- Fine-tune No Lag MACD parameters to align with your trading strategy.
- Identify Entry Points:
- Monitor when ZLEMA crosses above the price, signaling a potential buy.
- Confirm with No Lag MACD crossover or divergence signals.
- Determine Exit Points:
- Look for ZLEMA crossing below the price or adverse signals from No Lag MACD.
- Risk Management:
- Set stop-loss orders just below recent support levels.
- Define take-profit targets based on historical resistance or predefined profit margins.
Evaluating Performance Metrics
Performance metrics are crucial in evaluating any trading strategy:
Accuracy Rate: The IMRv1.0 Strategy boasts an accuracy rate often exceeding 70%. Incorporating a simple moving average filter can push this rate above 80%, though it may result in fewer trades.
Profit Factor: The profit factor typically ranges from 1.7 to 2.3, indicating a favorable return relative to risk.
This strategy’s strength lies in its ability to adapt through indicator fine-tuning and real-time market analysis, making it a valuable addition to any trader’s toolkit on TradingView.
By understanding how to implement and analyze the IMRv1.0 Strategy, you can use these insights for more effective trading decisions on TradingView.
2. LongBuyLongSell Indicator: Maximizing Profits with BTCUSD Pairing
The LongBuyLongSell Indicator, developed by MarxBabu, is designed to provide traders with clear buy and sell signals, maximizing profit opportunities. The indicator’s primary focus is on the BTCUSD pairing, making it particularly appealing for cryptocurrency traders.
Overview of the LongBuyLongSell Indicator
The LongBuyLongSell Indicator operates based on a set of algorithms that analyze market trends and price movements. It identifies optimal entry and exit points by evaluating historical data and current market conditions. This indicator aims to achieve high accuracy rates in predicting profitable trades, making it a valuable tool for traders seeking to maximize their gains.
Key features include:
- Algorithm-based signals: Utilizes complex algorithms to generate trading signals.
- User-friendly interface: Easy to interpret, even for novice traders.
- Alert system: Provides real-time alerts for trading opportunities.
Detailed Backtesting Results
Backtesting of the LongBuyLongSell Indicator on the BTCUSD pair reveals promising results:
- Timeframe: Tested primarily on a 30-minute timeframe.
- Accuracy rate: Over 80% accuracy in identifying correct entries.
- Profitability claims: Boasts a 90% profit rate, as per backtest results.
These impressive metrics highlight the indicator’s potential in delivering substantial returns. The real-time alert feature enhances its usability by informing traders of potential trades promptly.
Using the LongBuyLongSell Indicator can significantly improve your trading performance on TradingView, especially when paired with other high-profit trading strategies like the IMRv1.0 Strategy or techniques involving technical indicators such as ZLEMA or No lag MACD.
Incorporating advanced technical analysis trading software can further enhance your trading strategy, allowing you to explore various strategies and find the most suitable approach for your trading style and goals.
3. Chande Kroll Trend Strategy: Using Simple Moving Averages
The Chande Kroll Trend Strategy uses the Chande Kroll Stop indicator along with Simple Moving Averages (SMA) to find the best times to enter and exit trades. This strategy helps in spotting trend changes and confirming long positions.
Key Components:
- Chande Kroll Stop Indicator: This tool helps in identifying stop-loss levels by looking at price movements and how much they vary.
- Simple Moving Average (SMA): Used to smooth out price data, making it easier to see trends and possible reversal points.
Implementation Steps:
- Add Indicators: On TradingView, add both the Chande Kroll Stop indicator and a Simple Moving Average to your chart.
- Configure Settings: Adjust the settings of each indicator to match your trading style and timeframe.
- Identify Signals: Look for points where the price crosses above or below the SMA, confirmed by the Chande Kroll Stop levels, to decide when to enter and exit trades.
Example:
Imagine trading BTCUSD on a 1-hour chart. When the price crosses above the SMA while the Chande Kroll Stop indicates a bullish trend, this signals a potential buy opportunity. Conversely, when the price dips below the SMA with bearish confirmation from Chande Kroll Stop, it suggests an exit or short position.
Using these indicators together aims to improve accuracy in predicting market movements, working well with other high-profit trading strategies on TradingView like the IMRv1.0 Strategy, LongBuyLongSell Indicator, and more.
4. 5 EMA Strategy: Short-Term Selling and Buying Techniques Unveiled
The 5 EMA Strategy is one of the top trading strategies on TradingView, known for its focus on short-term buying and selling techniques. This strategy uses the 5-period Exponential Moving Average (EMA) to spot potential trading opportunities.
How the 5 EMA Strategy Works
- Short-Term Focus: This strategy is all about quick decisions, ideal for traders who thrive in fast-paced trading environments.
- Timeframes: It works best on shorter timeframes like 5-minute and 15-minute charts to catch rapid market movements.
- Signal Generation:
- Buying Signal: When the price goes above the 5 EMA, it signals a buying opportunity.
- Selling Signal: On the other hand, when the price drops below the 5 EMA, it triggers a selling signal.
- Entry and Exit Points: Traders look for clear crosses of the price over or under the 5 EMA to decide when to enter or exit trades.
How to Use It on TradingView
- Add Indicator:
- Go to TradingView’s indicator section.
- Search for “EMA” and select “Exponential Moving Average.”
- Adjust Settings:
- Set the period to
5for a more responsive moving average line.
- Apply Strategy Rules:
- Watch how prices move relative to the 5 EMA line.
- Place buy orders when the price crosses above the EMA.
- Execute sell orders when it crosses below.
Real-Life Examples
Let’s look at a BTCUSD chart on a 15-minute timeframe:
- Buying Example: If BTCUSD’s price breaks above its 15-minute 5 EMA after a downtrend, it signals a potential upward movement, prompting a buy.
- Selling Example: If BTCUSD falls below its 15-minute 5 EMA after an uptrend, it indicates a possible decline, suggesting a sell.
This approach gives traders quick entry and exit points, maximizing their profit potential in volatile conditions. By focusing on short-term movements, traders can make multiple small gains throughout the trading day.
Knowing strategies like this one that use ZLEMA and No Lag MACD indicators or tools such as MarxBabu’s LongBuyLongSell Indicator for BTCUSD pairs can enhance your use of the 5 EMA Strategy for varied trading methods.
5. ATR_RSI_Strategy: Navigating Volatile Markets with Average True Range and Relative Strength Index Indicators
The ATR_RSI_Strategy is particularly effective in volatile markets, leveraging the Average True Range (ATR) and Relative Strength Index (RSI) to optimize trade decisions. This strategy emphasizes the importance of incorporating volatility measures, such as ATR, to gauge market fluctuations and adjust entry/exit points accordingly.
Key Components
- Average True Range (ATR): Measures market volatility by considering the full range of price movements over a given period. High ATR values indicate increased volatility, while low values suggest a more stable market.
- Relative Strength Index (RSI): A momentum oscillator that evaluates the speed and change of price movements on a scale from 0 to 100. RSI values above 70 typically indicate overbought conditions, while values below 30 signal oversold conditions.
Implementation on TradingView
To implement the ATR_RSI_Strategy on TradingView:
- Add Indicators: Apply both the ATR and RSI indicators to your chart.
- Set Parameters: Customize the settings for each indicator based on your trading preferences.
- Signal Generation: Look for key signals:
- High ATR coupled with RSI crossing above 30 can signal a potential buy.
- Low ATR with RSI crossing below 70 may suggest a sell opportunity.
This strategy’s ability to adapt to varying market conditions makes it a valuable tool in your trading arsenal, similar to other high-profit strategies like the IMRv1.0 Strategy and LongBuyLongSell Indicator.
6. Support Resistance Strategy: Leveraging Price Action for Profitable Trades
Support and resistance levels are fundamental concepts in trading, serving as key indicators for identifying potential entry and exit points. Support represents a price level where a downtrend can be expected to pause due to a concentration of buying interest. Resistance, on the other hand, is a price level where an uptrend can be expected to pause due to a concentration of selling interest.
Practical examples illustrate how support and resistance levels can be utilized effectively:
1. Identifying Support Levels:
- Imagine the BTCUSD pair drops to $30,000 multiple times but doesn’t fall below this level. This repeated bounce suggests a strong support level at $30,000.
- Traders might place buy orders around this support level, anticipating that the price will rise once again.
2. Identifying Resistance Levels:
- Suppose the same BTCUSD pair struggles to break above $40,000 over several attempts. This indicates a strong resistance level at $40,000.
- Traders might place sell orders near this resistance point, expecting the price to fall after touching it.
How Price Action is Used:
- Price action trading involves making decisions based on recent and historical price movements rather than relying solely on technical indicators like ZLEMA or No lag MACD used in the IMRv1.0 Strategy.
- For instance, if a stock frequently bounces between $50 (support) and $60 (resistance), traders can aim to buy near $50 and sell near $60.
Combining these levels with other indicators such as the Chande Kroll Stop indicator or Simple Moving Averages (SMA) can enhance the accuracy of trades. By observing how prices react at these critical junctures, you can make informed decisions that align with high-profit trading strategies available on TradingView.
This method’s simplicity and efficacy make it a popular choice among traders looking for reliable ways to maximize their profits while navigating various market conditions.
7. Multiple Moving Averages Strategies: Using Crossover Signals for Timely Entry/Exit Points
Multiple moving averages strategies are highly effective in identifying timely entry and exit points by leveraging crossover signals. These strategies involve using different types of moving averages such as Simple Moving Averages (SMA), Exponential Moving Averages (EMA), and Weighted Moving Averages (WMA) to generate buy/sell opportunities.
Key Moving Average Strategies on TradingView:
1. Golden Cross and Death Cross:
- Golden Cross: This signal occurs when a short-term moving average crosses above a long-term moving average, indicating a bullish trend.
- Death Cross: Conversely, this signal happens when a short-term moving average crosses below a long-term moving average, suggesting a bearish trend.
2. Dual Moving Average Crossover:
- Utilizes two EMAs, such as the 50 EMA and 200 EMA.
- A buy signal is generated when the shorter EMA crosses above the longer EMA.
- A sell signal is triggered when the shorter EMA crosses below the longer EMA.
3. Triple Moving Average Crossover:
- Involves three moving averages, often the 5 EMA, 20 EMA, and 50 EMA.
- When the shortest moving average (5 EMA) crosses above both the intermediate (20 EMA) and the longest (50 EMA), it indicates a strong bullish trend.
- A bearish trend is signaled when the shortest moving average crosses below both the intermediate and longest moving averages.
Advantages of Using Multiple Moving Averages Strategies:
- Clear Trend Identification: These strategies help in clearly identifying market trends by smoothing out price data.
- Timely Signals: By using crossovers, traders can receive timely signals for entering or exiting trades.
- Adaptability: Suitable for various timeframes and markets, including cryptocurrencies like BTCUSD.
Implementing on TradingView:
To implement multiple moving averages strategies on TradingView:
- Use built-in indicators like SMA, EMA, or WMA.
- Customize settings to fit your trading style.
- Backtest these strategies to validate their effectiveness.
These strategies are part of high-profit trading methodologies on TradingView that harness technical indicators like ZLEMA, No lag MACD, and RSI for enhanced accuracy.
The Importance of Backtesting and Validation in High-Profit Trading Strategies
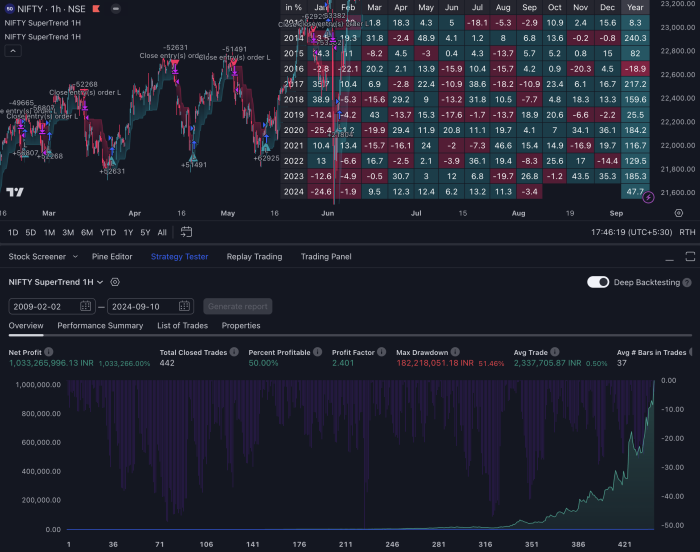
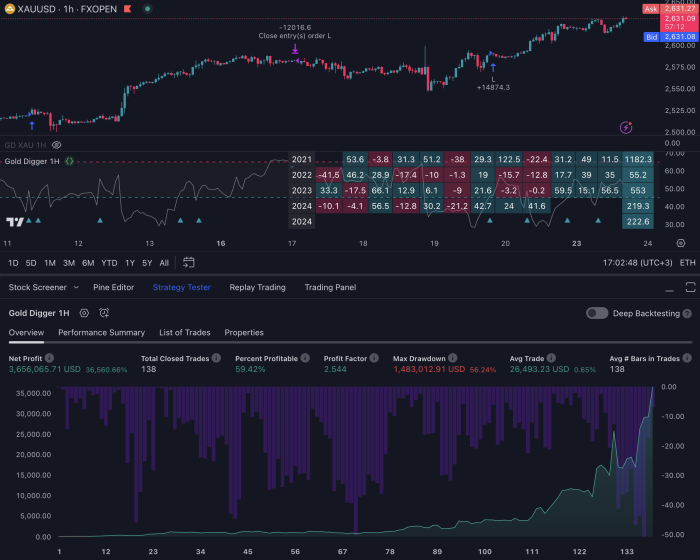
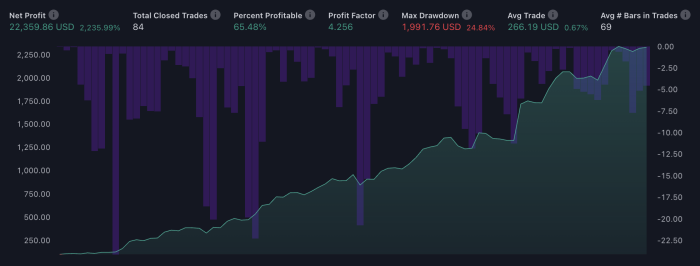
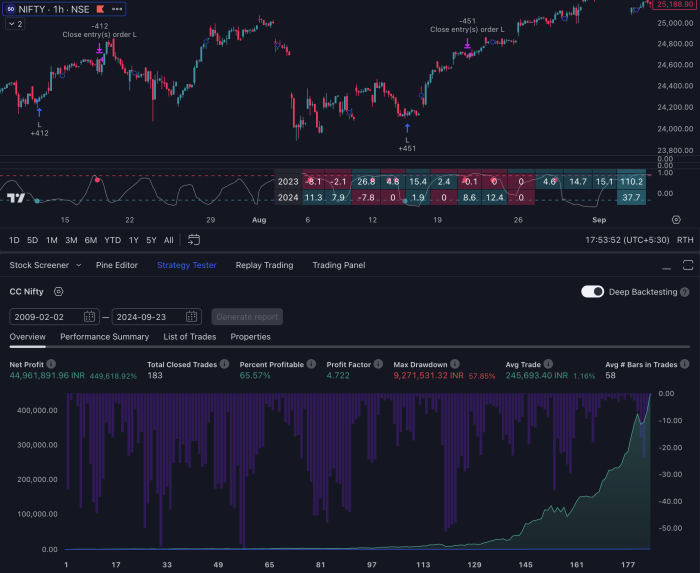
High-profit trading strategies promise substantial returns, but they also come with inherent risks. Backtesting is essential to assess the effectiveness and robustness of these strategies before deploying them in live markets. By simulating how a strategy would have performed using historical data, you can evaluate its potential profitability and identify possible flaws.
Key Benefits of Backtesting
- Identifying Weaknesses: Spot areas where the strategy may fail or underperform.
- Optimizing Parameters: Fine-tune settings to enhance overall performance.
- Building Confidence: Gain assurance in your strategy’s ability to generate profits.
Practical Tips for Conducting Thorough Backtests
When using TradingView for backtesting, follow these practical tips to ensure accuracy:
- Use Sufficient Historical Data:
- Ensure you have an extensive amount of historical data to test your strategy across different market conditions.
- Verify that the data includes various market phases like bull, bear, and sideways markets.
- Set Realistic Assumptions:
- Include realistic assumptions such as slippage, commission fees, and order execution delays.
- Avoid overly optimistic parameters that may not hold up in real-world trading.
- Segment Your Testing Periods:
- Divide your dataset into distinct periods for training (optimizing) and testing (validation).
- This helps prevent overfitting, where a strategy performs well on historical data but poorly in live markets.
- Monitor Performance Metrics:
- Key metrics to watch include accuracy rate, profit factor, drawdown, and Sharpe ratio.
- Compare these metrics against benchmarks or alternative strategies for a comprehensive evaluation.
Common Pitfalls to Avoid
Avoid these common pitfalls during backtesting:
- Overfitting: Tweaking a strategy excessively to fit past data perfectly. This often results in poor real-time performance.
- Ignoring Market Conditions: Failing to account for different market environments can lead to misleading results.
- Neglecting Transaction Costs: Overlooking costs like commissions and slippage can significantly distort performance outcomes.
By carefully conducting backtests and validating your high-profit trading strategies, you ensure they are not only theoretically sound but also practically viable. This comprehensive approach minimizes risks and enhances the likelihood of achieving consistent profitability in live trading environments.
Adapting High-Profit Strategies Across Different Asset Classes
High-profit trading strategies can be used across various asset classes like cryptocurrencies, forex pairs, and equities. This flexibility is essential for traders who want to diversify their portfolios and take advantage of multiple market opportunities.
Cryptocurrencies
Cryptocurrencies like Bitcoin and Ethereum are known for their high volatility, making them attractive for high-profit strategies. Key considerations include:
- Liquidity: Cryptos often experience dramatic price swings, but liquidity varies across different coins. It’s important to understand the liquidity profiles of each cryptocurrency.
- Regulatory Frameworks: Varying regulations by country can impact trading conditions and the availability of certain assets.
Forex Pairs
Forex markets offer a unique set of challenges and opportunities due to their massive liquidity and 24-hour trading cycle. When adapting strategies to forex pairs, consider:
- Market Hours: Forex operates 24/5 with significant activity during overlapping market sessions.
- Currency Correlations: Understanding correlations between currency pairs can enhance strategy effectiveness.
Equities
Equities present another arena where high-profit strategies can thrive. Important factors for equities include:
- Earnings Reports: Equities are heavily influenced by quarterly earnings reports which can create significant price movements.
- Sector Analysis: Different sectors may have varying levels of volatility and liquidity.
Key Considerations for Adapting Strategies
When adapting high-profit trading strategies to different asset classes, it’s important to align with each market’s unique characteristics:
- Liquidity Profiles: Liquidity can affect the execution of trades. High liquidity generally ensures smoother trade execution.
- Regulatory Frameworks: Compliance with local regulations is essential to avoid legal complications.
By tailoring your approach to the specific attributes of each market, you enhance the potential effectiveness of high-profit trading strategies across various asset classes.
Conclusion
High-profit trading strategies on TradingView offer a wealth of opportunities for traders aiming to maximize their returns. These strategies, powered by sophisticated technical indicators and adaptable to various market conditions, provide a robust framework for making informed trading decisions. However, it is crucial to recognize the inherent risks associated with high-return strategies. Market volatility, liquidity issues, and timing errors can impact profitability.
The good news is that TradingView’s platform gives traders the tools they need to fully understand these strategies. By using features like backtesting and validation, you can evaluate how effective different strategies are before investing real money. In the ever-changing world of finance, it’s essential to keep learning and adjusting your approach. Stay flexible, stay informed, and make use of the wide range of high-profit trading strategies on TradingView to improve your trading results.
Explore, learn, adapt. Embrace the potential that TradingView’s high-profit trading strategies offer while staying mindful of the associated risks.
FAQs (Frequently Asked Questions)
What are high-profit trading strategies?
High-profit trading strategies refer to techniques designed to generate substantial returns in a short period. These strategies leverage various market conditions and technical indicators to maximize profit potential.
How does TradingView support traders in implementing high-profit strategies?
TradingView provides a robust platform for traders to access, analyze, and implement high-profit trading strategies. It offers a wide range of tools, including charting features and technical indicators, which enhance the effectiveness of these strategies.
What role do technical indicators play in trading strategies?
Technical indicators are essential in trading strategies as they help enhance the accuracy and reliability of trading signals. They provide insights into market trends, momentum, and potential reversals, aiding traders in making informed decisions.
Can you give examples of popular high-profit trading strategies available on TradingView?
Some popular high-profit trading strategies on TradingView include the IMRv1.0 Strategy, LongBuyLongSell Indicator, Chande Kroll Trend Strategy, 5 EMA Strategy, ATR_RSI_Strategy, and Support Resistance Strategy. Each strategy has unique features that cater to different market conditions.
What is the IMRv1.0 Strategy?
The IMRv1.0 Strategy is a comprehensive trading approach that utilizes key components such as ZLEMA and No Lag MACD indicators. It includes a step-by-step guide for implementation on TradingView and provides performance metrics like accuracy rate and profit factor.
How do market conditions affect the profit potential of trading strategies?
Market conditions significantly influence the profit potential of trading strategies. Factors such as market volatility, liquidity, and timing play crucial roles in determining how well a strategy performs. Adapting these strategies to specific market conditions is essential for optimal results.

