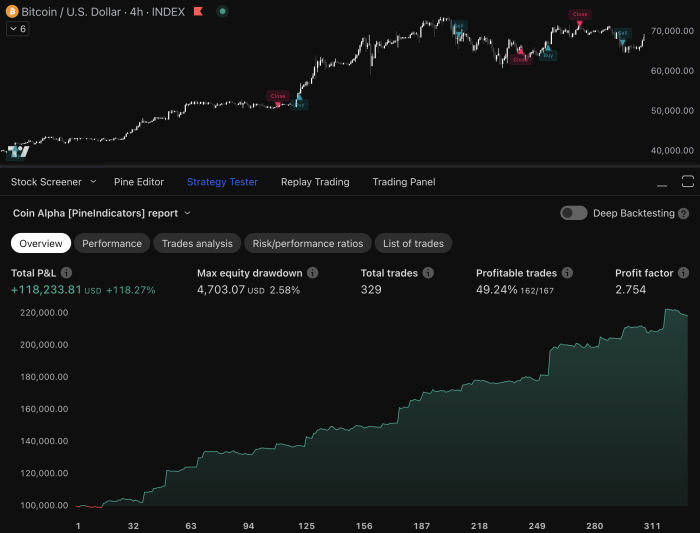
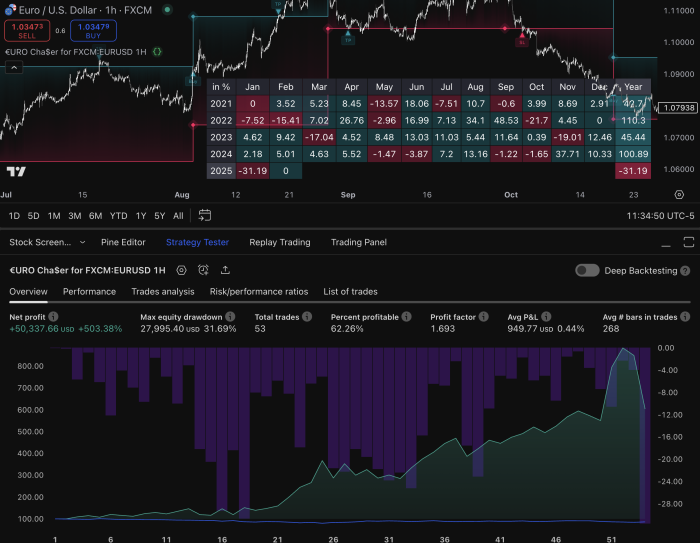
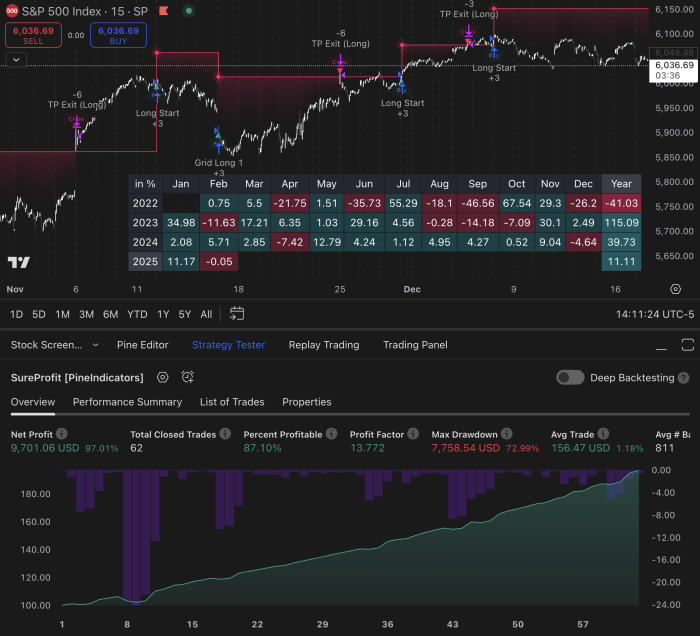
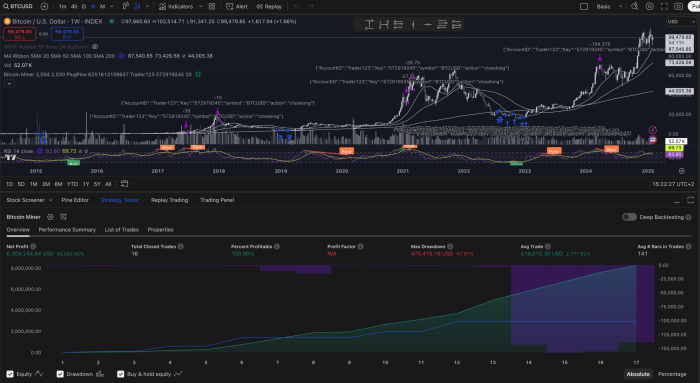
Algorithmic trading has revolutionized the financial markets, allowing traders to execute orders at speeds and frequencies that are impossible for human traders. At the heart of this automated trading approach lies the use of indicators—mathematical calculations based on price, volume, or open interest of a security. These indicators serve as essential tools for traders, providing insights into market trends, potential reversals, and overall market sentiment.
As the landscape of trading continues to evolve, understanding the intricacies of these indicators becomes paramount for anyone looking to harness the power of algorithmic trading. Indicators can be broadly categorized into two types: leading and lagging indicators. Leading indicators aim to predict future price movements, while lagging indicators confirm trends that have already occurred.
This distinction is crucial for traders as it influences their decision-making process. For instance, a leading indicator like the Relative Strength Index (RSI) may signal an overbought condition, prompting a trader to consider a sell position before a price drop occurs. Conversely, a lagging indicator such as the Moving Average (MA) may help confirm a trend’s strength after it has already begun.
Understanding these nuances is essential for developing effective trading strategies that leverage the strengths of various indicators.
Key Takeaways
- Algorithmic trading indicators are tools used to analyze market data and make trading decisions based on mathematical calculations and historical price data.
- Indicators play a crucial role in algorithmic trading by providing traders with valuable insights into market trends, momentum, volatility, and other key factors that can impact trading strategies.
- When choosing indicators for a trading strategy, it’s important to consider factors such as the market being traded, the time frame of the strategy, and the trader’s risk tolerance and trading style.
- Implementing indicators in algorithmic trading systems involves coding the indicators into the trading algorithm and integrating them with other components such as risk management rules and order execution logic.
- Backtesting and optimizing indicators is essential for maximizing profitability in algorithmic trading, as it helps traders identify the most effective parameters and settings for their chosen indicators.
Understanding the Role of Indicators in Algorithmic Trading
Indicators play a pivotal role in algorithmic trading by providing quantitative data that can be analyzed to make informed trading decisions. They help traders identify patterns and trends in historical data, which can be extrapolated to forecast future price movements. For example, moving averages smooth out price data to identify the direction of the trend over a specific period.
When prices cross above or below a moving average, it can signal potential buy or sell opportunities. This systematic approach allows traders to remove emotional biases from their decision-making processes, relying instead on data-driven insights. Moreover, indicators can be combined to create complex trading strategies that enhance predictive accuracy.
For instance, a trader might use a combination of the MACD (Moving Average Convergence Divergence) and Bollinger Bands to identify entry and exit points. The MACD can indicate momentum shifts, while Bollinger Bands can provide context regarding volatility and potential price reversals. By integrating multiple indicators, traders can develop a more robust framework for analyzing market conditions and executing trades with greater confidence.
Choosing the Right Indicators for Your Trading Strategy

Selecting the appropriate indicators is crucial for the success of any algorithmic trading strategy. The choice often depends on various factors, including the trader’s objectives, risk tolerance, and market conditions. For instance, day traders may prefer indicators that provide quick signals and are sensitive to short-term price movements, such as the Stochastic Oscillator or the Average True Range (ATR).
These indicators can help capture rapid fluctuations in price, allowing traders to capitalize on short-lived opportunities. On the other hand, swing traders or long-term investors might gravitate towards indicators that provide insights over longer time frames. Tools like the 200-day moving average or Fibonacci retracement levels can help identify significant support and resistance levels that are more relevant for longer-term positions.
Additionally, it is essential to consider the correlation between chosen indicators; using highly correlated indicators may lead to redundant signals and reduce the effectiveness of the strategy. A well-rounded approach involves testing various combinations of indicators to find those that complement each other and align with the trader’s overall strategy.
Implementing Indicators in Algorithmic Trading Systems
| Indicator | Definition | Usage |
|---|---|---|
| Simple Moving Average (SMA) | The average price of a security over a specific time period | To identify trends and potential reversal points |
| Relative Strength Index (RSI) | A momentum oscillator that measures the speed and change of price movements | To determine overbought or oversold conditions |
| Bollinger Bands | A volatility indicator that consists of a middle band, upper band, and lower band | To identify potential overbought or oversold conditions and volatility changes |
| MACD (Moving Average Convergence Divergence) | A trend-following momentum indicator that shows the relationship between two moving averages | To identify trend direction and potential trend reversals |
Once the right indicators have been selected, the next step is implementing them within an algorithmic trading system. This process typically involves coding the chosen indicators into a trading platform or software that supports algorithmic trading. Popular platforms like MetaTrader, NinjaTrader, and TradingView offer extensive libraries of built-in indicators and allow for custom coding using languages such as MQL4/5 or Pine Script.
The implementation phase also requires careful consideration of how signals generated by indicators will trigger trades. For example, a simple strategy might involve placing a buy order when a short-term moving average crosses above a long-term moving average while simultaneously ensuring that other conditions—such as volume thresholds—are met. This systematic approach minimizes human error and ensures that trades are executed consistently according to predefined criteria.
Moreover, it is essential to incorporate risk management rules into the algorithm during this phase. This could involve setting stop-loss orders based on indicator signals or adjusting position sizes according to volatility measures provided by indicators like ATR. By embedding risk management directly into the algorithm, traders can protect their capital while still pursuing profitable opportunities.
Backtesting and Optimizing Indicators for Maximum Profitability
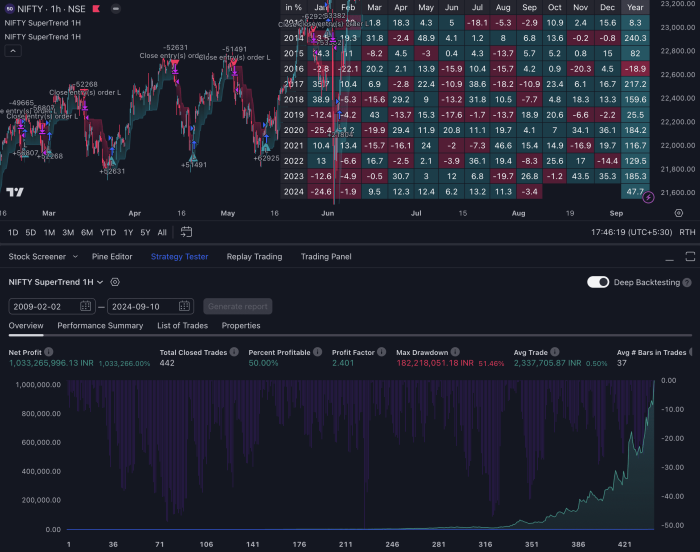
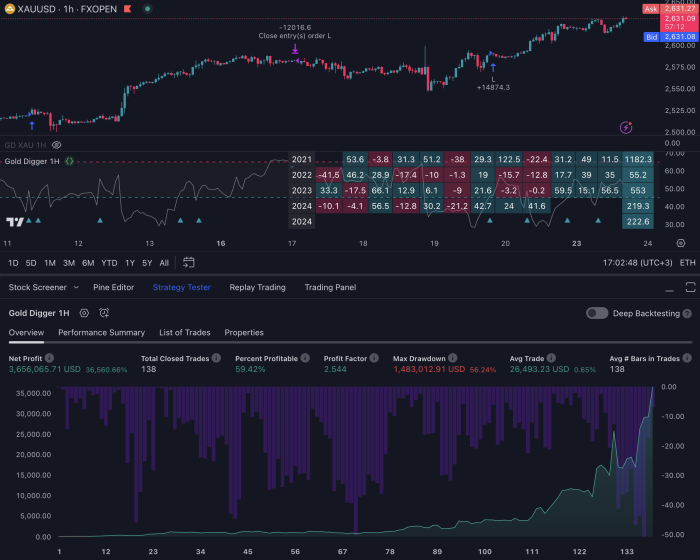
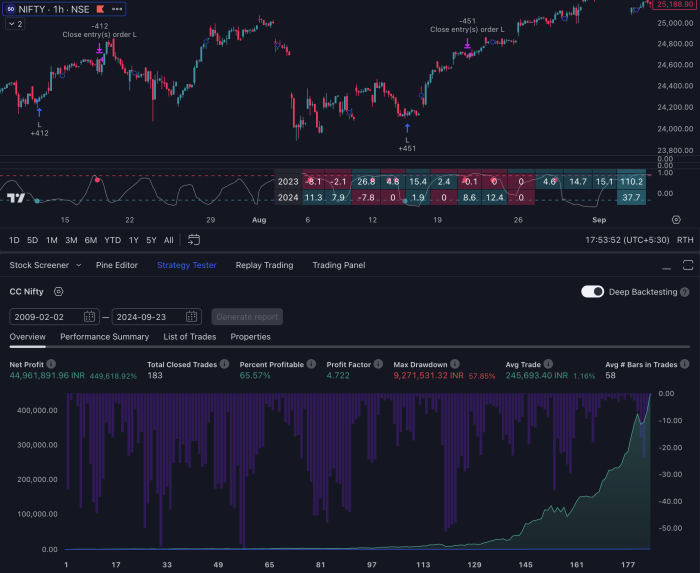
Backtesting is a critical step in validating an algorithmic trading strategy that utilizes indicators.
This process involves applying the trading strategy to historical market data to assess its performance over time.
By simulating trades based on past price movements and indicator signals, traders can evaluate how well their chosen indicators would have performed in various market conditions.
During backtesting, it is vital to analyze key performance metrics such as win rate, average profit per trade, maximum drawdown, and overall return on investment (ROI). These metrics provide insights into the effectiveness of the chosen indicators and help identify areas for improvement. For instance, if backtesting reveals that a particular indicator consistently leads to losses during specific market conditions—such as high volatility—traders may need to adjust their strategy or consider alternative indicators.
Optimization is another crucial aspect of this phase. Traders often tweak parameters associated with their indicators—such as period lengths for moving averages or threshold levels for oscillators—to enhance performance. However, caution must be exercised during optimization to avoid overfitting, where a strategy performs exceptionally well on historical data but fails in live markets due to its specificity to past conditions.
A balanced approach involves optimizing parameters while maintaining robustness across different market scenarios.
Managing Risk and Controlling Drawdowns with Indicators

Locking in Profits with Stop-Loss Orders
For example, using trailing stop-loss orders based on volatility indicators like Bollinger Bands can help lock in profits while allowing for potential upside as prices move favorably.
Position Sizing Techniques
Incorporating position sizing techniques based on indicator signals can further enhance risk management efforts. For instance, if an indicator suggests a high probability trade with strong momentum, a trader might choose to increase their position size accordingly. Conversely, if an indicator indicates uncertainty or potential reversal signals, reducing position size or even refraining from trading altogether may be prudent.
Controlling Drawdowns
Controlling drawdowns is another critical aspect of risk management that can be addressed through indicator usage.
By monitoring drawdown levels in real-time using performance metrics derived from indicators, traders can make informed decisions about when to exit losing positions or adjust their strategies.
This proactive approach helps preserve capital and maintain psychological resilience during periods of unfavorable market conditions.
Monitoring and Adjusting Indicators for Market Changes
The financial markets are dynamic environments influenced by various factors such as economic data releases, geopolitical events, and changes in market sentiment. As such, it is essential for traders employing algorithmic strategies to continuously monitor their chosen indicators and adjust them as necessary in response to evolving market conditions. This adaptability ensures that trading strategies remain relevant and effective over time.
For instance, during periods of heightened volatility—such as during major economic announcements—traders may need to adjust their indicator parameters to account for increased price fluctuations. A moving average that works well in stable markets may become less effective during turbulent times; thus, recalibrating its period length could enhance its responsiveness to rapid price changes. Similarly, traders might choose to switch from using daily charts to hourly charts during volatile periods to capture more granular price movements.
Furthermore, ongoing analysis of indicator performance is crucial for long-term success in algorithmic trading. Regularly reviewing how well indicators are performing against current market conditions allows traders to identify any discrepancies between expected outcomes and actual results. This continuous feedback loop enables traders to refine their strategies proactively rather than reactively addressing issues only after they arise.
Leveraging Indicators for Long-term Profitability in Algorithmic Trading
Incorporating indicators into algorithmic trading strategies offers traders a systematic approach to navigating complex financial markets. By understanding the role of various indicators and selecting those that align with their trading objectives, traders can develop robust strategies that capitalize on market opportunities while managing risk effectively. The implementation of these indicators within algorithmic systems allows for consistent execution of trades based on data-driven insights rather than emotional impulses.
Moreover, ongoing backtesting and optimization ensure that strategies remain effective across different market conditions while monitoring performance metrics helps manage risk and control drawdowns effectively. As markets evolve, so too must the strategies employed by traders; thus, continuous monitoring and adjustment of indicators are essential for maintaining long-term profitability in algorithmic trading endeavors. By leveraging these tools thoughtfully and strategically, traders can position themselves for sustained success in an increasingly competitive landscape.
If you are interested in algorithmic trading indicator services, you may also want to check out this article on indicator scripts for TradingView. This article provides valuable insights into how to use indicator scripts effectively to enhance your trading strategies and improve profitability. By incorporating these scripts into your trading routine, you can gain a competitive edge in the market and make more informed trading decisions.
FAQs
What is an algorithmic trading indicator service?
An algorithmic trading indicator service is a platform or service that provides traders with algorithmic trading indicators, which are mathematical calculations based on historical price, volume, or open interest data. These indicators are used to identify potential buy or sell signals in the financial markets.
How does an algorithmic trading indicator service work?
An algorithmic trading indicator service works by using complex mathematical algorithms to analyze historical market data and generate trading signals. These signals are then delivered to traders through the service’s platform, allowing them to make informed trading decisions.
What are the benefits of using an algorithmic trading indicator service?
Some benefits of using an algorithmic trading indicator service include:
– Access to advanced trading indicators and signals
– Automation of trading decisions based on predefined criteria
– Potential for improved trading performance and reduced emotional bias
Are there any risks associated with using an algorithmic trading indicator service?
While algorithmic trading indicator services can provide valuable insights, there are also risks to consider, such as:
– Reliance on historical data that may not accurately predict future market movements
– Potential for technical glitches or errors in the algorithmic calculations
– Over-reliance on automated trading signals without considering other market factors
Who can benefit from using an algorithmic trading indicator service?
Traders and investors who are looking to incorporate advanced technical analysis into their trading strategies may benefit from using an algorithmic trading indicator service. Additionally, those who are interested in automating their trading decisions based on predefined criteria may find value in these services.

