


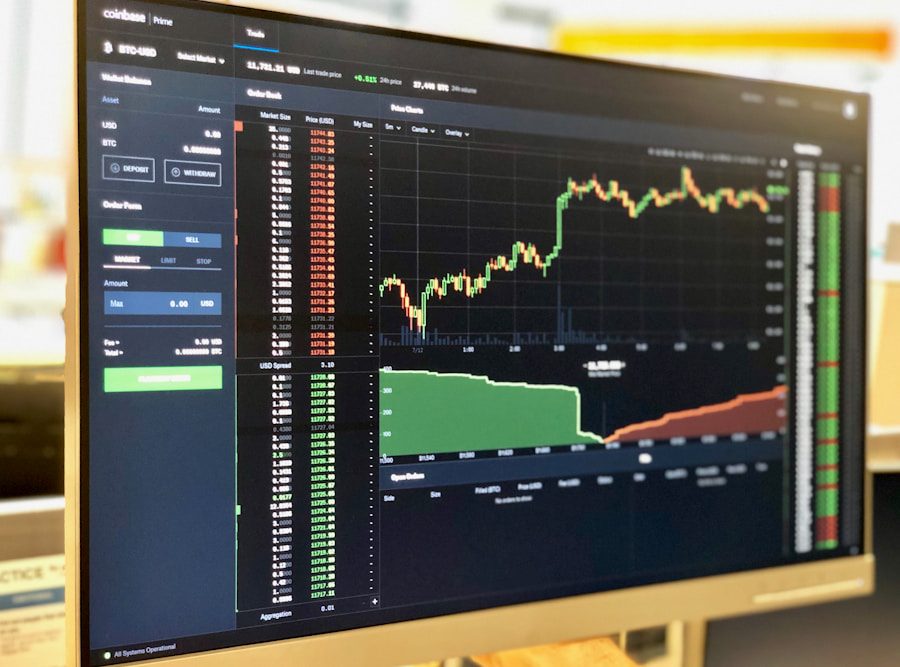
Trading indicators are essential tools in the arsenal of traders, providing insights into market trends, momentum, and potential price reversals. At their core, these indicators are mathematical calculations based on historical price and volume data. They serve to simplify the complexities of market behavior, allowing traders to make informed decisions.
Common types of trading indicators include trend indicators, momentum indicators, volatility indicators, and volume indicators. Each category serves a distinct purpose, helping traders analyze different aspects of market dynamics. For instance, trend indicators like Moving Averages (MA) and the Average Directional Index (ADX) help traders identify the direction of the market.
A simple moving average smooths out price data to create a trend-following indicator that can help determine whether to buy or sell. On the other hand, momentum indicators such as the Relative Strength Index (RSI) and Stochastic Oscillator measure the speed and change of price movements, indicating whether an asset is overbought or oversold. Understanding these foundational concepts is crucial for any trader looking to navigate the complexities of financial markets effectively.
Key Takeaways
- Trading indicators are tools used to analyze market data and make informed trading decisions.
- It’s important to choose trading indicators that align with your trading strategy and goals.
- Using multiple trading indicators can provide confirmation and strengthen your trading decisions.
- Setting clear entry and exit points with trading indicators helps to minimize risk and maximize profits.
- It’s crucial to manage risk and avoid over-reliance on trading indicators for successful trading.
Choosing the Right Trading Indicators for Your Strategy
Selecting the appropriate trading indicators is a critical step in developing a successful trading strategy. The choice largely depends on the trader’s style—whether they are day traders, swing traders, or long-term investors. For example, day traders often rely on short-term indicators that provide quick signals for entry and exit points.
Indicators like the Exponential Moving Average (EMA) or Bollinger Bands can be particularly useful in fast-paced trading environments, as they react more swiftly to price changes compared to their simple counterparts. Conversely, swing traders may benefit from a combination of trend and momentum indicators to capture larger price movements over several days or weeks. The MACD (Moving Average Convergence Divergence) is a popular choice among swing traders due to its ability to signal potential reversals and confirm trends.
Additionally, it is essential to consider the market conditions when selecting indicators. In a volatile market, for instance, volatility indicators like the Average True Range (ATR) can provide valuable insights into potential price swings, helping traders adjust their strategies accordingly.
Utilizing Multiple Trading Indicators for Confirmation
Using multiple trading indicators can enhance the reliability of trading signals and reduce the likelihood of false positives. This approach, known as confirmation, involves employing different types of indicators that complement each other. For example, a trader might use a trend indicator like the 50-day moving average alongside a momentum indicator such as the RSI.
When both indicators align—indicating a strong upward trend and an oversold condition—it can provide a more robust signal for entering a trade. However, it is crucial to avoid redundancy when selecting multiple indicators. Using several indicators that measure the same aspect of market behavior can lead to analysis paralysis and confusion.
Instead, traders should aim for a diverse set of indicators that provide unique insights. For instance, combining a trend indicator with a volatility indicator can offer a comprehensive view of market conditions. This multifaceted approach allows traders to make more informed decisions while minimizing risks associated with relying on a single indicator.
Setting Clear Entry and Exit Points with Trading Indicators
| Indicator | Entry Point | Exit Point |
|---|---|---|
| Simple Moving Average (SMA) | When price crosses above SMA | When price crosses below SMA |
| Relative Strength Index (RSI) | When RSI crosses above 30 | When RSI crosses below 70 |
| Bollinger Bands | When price touches lower band | When price touches upper band |
| MACD (Moving Average Convergence Divergence) | When MACD line crosses above signal line | When MACD line crosses below signal line |
Establishing clear entry and exit points is vital for effective trading, and trading indicators play a significant role in this process. Entry points are typically determined by identifying favorable conditions that suggest a high probability of price movement in the desired direction. For example, a trader might decide to enter a long position when the price crosses above a significant moving average while simultaneously observing bullish divergence on the RSI.
Exit points are equally important and can be defined using various methods, including profit targets and stop-loss orders. Traders often set profit targets based on previous resistance levels or Fibonacci retracement levels, while stop-loss orders can be placed below recent swing lows to protect against adverse price movements. Utilizing indicators like the ATR can help determine appropriate stop-loss distances by providing insights into current market volatility.
By clearly defining entry and exit points based on trading indicators, traders can maintain discipline and avoid emotional decision-making during trades.
Managing Risk and Protecting Profits with Trading Indicators
Risk management is an integral part of any trading strategy, and trading indicators can assist in this critical area. One common method is to use indicators to determine position sizing based on volatility. For instance, if the ATR indicates high volatility, a trader might choose to reduce their position size to mitigate risk.
Conversely, in low-volatility conditions, they may opt for larger positions since price movements are less erratic. Additionally, trailing stop-loss orders can be employed in conjunction with trading indicators to protect profits as trades move in favor of the trader. For example, if a trader enters a long position based on a bullish signal from the MACD and the price continues to rise, they might adjust their stop-loss order upward based on recent swing lows or key support levels identified through moving averages.
This strategy allows traders to lock in profits while still giving their trades room to grow.
Avoiding Over-reliance on Trading Indicators

While trading indicators are valuable tools, over-reliance on them can lead to detrimental outcomes. Many traders fall into the trap of believing that indicators alone can guarantee success without considering other critical factors such as market news, economic data releases, or geopolitical events that can significantly impact price movements. It is essential to remember that indicators are based on historical data and may not always accurately predict future price behavior.
Moreover, excessive reliance on multiple indicators can create confusion and lead to conflicting signals. Traders should strive for a balanced approach that incorporates both technical analysis through indicators and fundamental analysis that considers broader market conditions. By maintaining this balance, traders can develop a more comprehensive understanding of market dynamics and make more informed decisions.
Backtesting and Optimizing Trading Indicators for Maximum Profit
Backtesting is an essential process for traders looking to optimize their use of trading indicators. This involves applying a trading strategy using historical data to evaluate its effectiveness before deploying it in live markets. By analyzing past performance, traders can identify which indicators work best under specific market conditions and refine their strategies accordingly.
They could analyze how often this combination produced profitable trades and under what circumstances it failed. This process not only helps in identifying effective strategies but also aids in fine-tuning parameters such as indicator periods or thresholds for entry and exit signals.
The insights gained from backtesting can significantly enhance a trader’s confidence in their strategy when transitioning to real-time trading.
Staying Updated with Market Conditions and Adapting Trading Indicators Accordingly
The financial markets are dynamic environments influenced by various factors such as economic data releases, geopolitical events, and changes in market sentiment. As such, it is crucial for traders to stay updated with current market conditions and adapt their use of trading indicators accordingly. For instance, during periods of high volatility—such as major economic announcements—traders may need to adjust their strategies by incorporating more responsive indicators or widening their stop-loss levels.
Additionally, keeping abreast of news events can provide context for price movements that may not be immediately apparent through technical analysis alone. For example, if an unexpected economic report causes significant market fluctuations, relying solely on historical data from trading indicators may not yield accurate predictions about future price behavior. By integrating real-time information with technical analysis through trading indicators, traders can make more informed decisions that reflect current market realities.
In conclusion, understanding trading indicators involves recognizing their fundamental role in analyzing market behavior and making informed trading decisions. Choosing the right indicators tailored to one’s strategy is crucial for success in various trading styles. Utilizing multiple indicators for confirmation enhances reliability while setting clear entry and exit points ensures disciplined trading practices.
Effective risk management strategies protect profits while avoiding over-reliance on indicators fosters a balanced approach to trading. Backtesting allows for optimization of strategies based on historical performance, while staying updated with market conditions ensures adaptability in an ever-changing environment. By mastering these aspects of trading indicators, traders can significantly improve their chances of achieving consistent profitability in financial markets.
If you are interested in learning more about trading indicators and how they can streamline your strategy, you may want to check out this article on expert trading automation scripts. This article delves into how automation can help you make more informed trading decisions and optimize your trading strategy. It also discusses the benefits of using Pine Script for developing trading strategies, which is covered in another informative article on trading strategy evaluation techniques helpful.
FAQs
What are trading indicators?
Trading indicators are tools used by traders to analyze market data and make informed decisions about buying or selling assets. These indicators are based on mathematical calculations and can help identify trends, momentum, volatility, and other important market factors.
How do trading indicators work?
Trading indicators work by analyzing historical price data and presenting it in a visual format, such as a line on a chart. Traders use these visual representations to identify patterns and trends in the market, which can help them make predictions about future price movements.
What are some common types of trading indicators?
Some common types of trading indicators include moving averages, relative strength index (RSI), stochastic oscillator, Bollinger Bands, and MACD (Moving Average Convergence Divergence). Each indicator has its own unique way of analyzing market data and providing insights to traders.
How are trading indicators used in trading?
Traders use indicators to identify potential entry and exit points for trades, as well as to confirm the strength of a trend or the likelihood of a trend reversal. Indicators can also be used to set stop-loss and take-profit levels, as well as to manage risk in trading strategies.
Are trading indicators always accurate?
No, trading indicators are not always accurate. They are based on historical data and mathematical calculations, so they can provide false signals or lag behind actual market movements. It’s important for traders to use indicators in conjunction with other forms of analysis and to consider the limitations of each indicator.
