


TradingView has emerged as a powerful platform for traders and investors, offering a plethora of tools and features that facilitate the development and execution of trading strategies. At its core, a TradingView strategy is a systematic approach to trading that combines technical analysis, market data, and user-defined parameters to identify potential entry and exit points in the market. The platform allows users to create custom scripts using Pine Script, a domain-specific language designed for writing trading indicators and strategies.
This flexibility enables traders to tailor their strategies to fit their unique trading styles and risk tolerances. A well-structured TradingView strategy typically encompasses several components, including entry signals, exit signals, stop-loss orders, and profit targets. By defining these elements clearly, traders can automate their decision-making processes, reducing the emotional stress often associated with trading.
Moreover, TradingView’s extensive community of traders contributes to a rich repository of shared strategies and scripts, allowing users to learn from one another and refine their approaches. Understanding the nuances of TradingView strategies is essential for anyone looking to navigate the complexities of financial markets effectively.
Key Takeaways
- TradingView Strategy is a powerful tool for creating and testing trading strategies using a wide range of technical indicators and charting tools.
- Identifying profitable trading opportunities involves analyzing price movements, volume, and market trends to make informed decisions.
- Utilizing technical indicators such as moving averages, RSI, and MACD can help traders make better decisions and improve their chances of success.
- Backtesting and optimizing trading strategies is essential for evaluating their performance and making necessary adjustments for maximum profitability.
- Implementing risk management techniques such as setting stop-loss orders and position sizing is crucial for protecting capital and minimizing losses.
Identifying Profitable Trading Opportunities
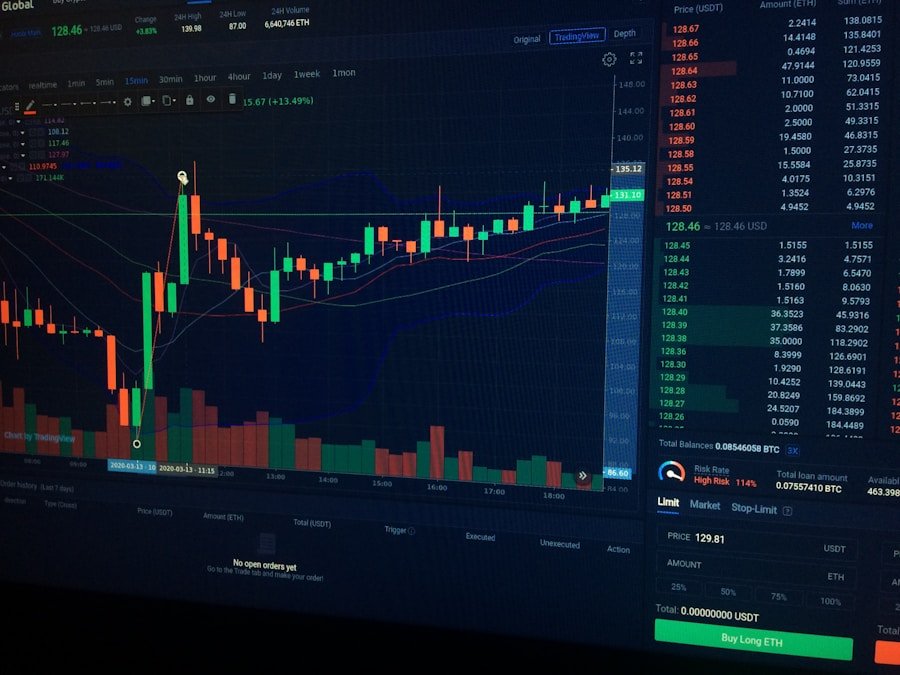
Identifying profitable trading opportunities is a critical skill for any trader, and TradingView provides an array of tools to assist in this endeavor. One of the primary methods for spotting potential trades is through the analysis of price action and chart patterns. Traders can utilize various chart types—such as candlestick, line, or bar charts—to visualize market movements and identify trends.
For instance, recognizing patterns like head and shoulders or double tops can signal potential reversals, while flags and pennants may indicate continuation patterns. In addition to chart patterns, traders can leverage TradingView’s screener tools to filter stocks or assets based on specific criteria such as price movements, volume changes, or technical indicators. This functionality allows traders to narrow down their focus to assets that meet their trading criteria, increasing the likelihood of finding profitable opportunities.
Furthermore, the platform’s social features enable users to follow other traders and view their analyses, providing additional insights into market sentiment and potential trades. By combining technical analysis with community insights, traders can enhance their ability to identify lucrative trading opportunities.
Utilizing Technical Indicators for Better Decision Making

Technical indicators are essential tools in a trader’s arsenal, providing quantitative data that can inform decision-making processes. TradingView offers a vast library of built-in indicators, such as Relative Strength Index (RSI), Bollinger Bands, and MACD, among others. Each indicator serves a specific purpose; for example, moving averages help smooth out price data to identify trends over time, while RSI measures the speed and change of price movements to determine overbought or oversold conditions.
Traders can also customize these indicators or create their own using Pine Script to better suit their trading strategies. For instance, a trader might develop a custom indicator that combines multiple existing indicators to generate more reliable signals. By analyzing the interplay between different indicators—such as using MACD in conjunction with RSI—traders can gain deeper insights into market dynamics and make more informed decisions.
The ability to visualize these indicators on TradingView’s interactive charts further enhances understanding and allows for real-time adjustments based on market conditions.
Backtesting and Optimizing Trading Strategies
| Strategy | Sharpe Ratio | Maximum Drawdown | Winning Trades | Losing Trades |
|---|---|---|---|---|
| Mean Reversion | 1.25 | 8% | 60 | 40 |
| Trend Following | 1.45 | 5% | 70 | 30 |
| Pairs Trading | 1.10 | 10% | 55 | 45 |
Backtesting is a crucial step in developing a robust trading strategy, allowing traders to evaluate how their strategies would have performed in historical market conditions. TradingView provides an intuitive backtesting feature that enables users to simulate trades based on historical data. By inputting specific parameters such as entry and exit signals, stop-loss levels, and position sizing, traders can assess the effectiveness of their strategies over various time frames and market conditions.
The optimization process involves tweaking strategy parameters to enhance performance metrics such as win rate, profit factor, and maximum drawdown. Traders can experiment with different settings to find the optimal configuration that maximizes returns while minimizing risk.
This iterative process not only helps refine strategies but also builds confidence in their effectiveness before deploying them in live markets.
Implementing Risk Management Techniques
Effective risk management is paramount in trading, as it helps protect capital and ensures long-term sustainability in the markets. TradingView allows traders to incorporate various risk management techniques into their strategies. One fundamental approach is position sizing, which involves determining how much capital to allocate to each trade based on account size and risk tolerance.
A common rule is to risk no more than 1-2% of total capital on any single trade. Additionally, setting stop-loss orders is another critical component of risk management. Traders can define stop-loss levels based on technical analysis—such as placing them just below support levels or above resistance levels—to limit potential losses.
TradingView’s alert system can notify traders when prices approach these levels, ensuring they remain disciplined in adhering to their risk management rules. By integrating these techniques into their TradingView strategies, traders can mitigate risks while pursuing profitable opportunities.
Leveraging Automation and Alerts
Automation is a game-changer in trading, allowing traders to execute strategies without constant monitoring of the markets. TradingView supports automation through its alert system and Pine Script capabilities. Traders can set up alerts based on specific conditions—such as price crossing a certain level or an indicator reaching a predefined threshold—enabling them to react promptly without being glued to their screens.
For instance, a trader might set an alert for when a stock’s price crosses above its 50-day moving average, signaling a potential buy opportunity. Once the alert triggers, the trader can decide whether to act immediately or analyze further before executing the trade. This level of automation not only saves time but also helps eliminate emotional decision-making that can lead to poor trading outcomes.
By leveraging these features effectively, traders can enhance their efficiency and responsiveness in dynamic market environments.
Integrating Fundamental Analysis into TradingView Strategy
While technical analysis plays a significant role in trading strategies on TradingView, integrating fundamental analysis can provide a more comprehensive view of potential investments. Fundamental analysis involves evaluating a company’s financial health through metrics such as earnings reports, revenue growth, debt levels, and industry trends. Traders can use TradingView’s built-in financial data features to access key financial ratios and performance indicators directly from the platform.
For example, a trader might analyze a company’s earnings per share (EPS) growth alongside its stock price trends on TradingView charts. If the EPS shows consistent growth while the stock price remains relatively stable or undervalued compared to its peers, this could indicate a buying opportunity. Additionally, keeping an eye on macroeconomic factors—such as interest rates or geopolitical events—can further inform trading decisions.
By blending technical and fundamental analysis within their TradingView strategies, traders can develop a more nuanced understanding of market dynamics.
Continuously Evaluating and Adjusting Strategies for Maximum Profitability
The financial markets are inherently dynamic; therefore, continuous evaluation and adjustment of trading strategies are essential for maintaining profitability over time. Traders should regularly review their performance metrics—such as win rates, average gains versus losses, and overall return on investment—to identify areas for improvement. TradingView’s analytics tools provide valuable insights into past trades, helping traders understand what worked well and what did not.
Moreover, adapting strategies in response to changing market conditions is crucial. For instance, during periods of high volatility, a trader may need to adjust their stop-loss levels or position sizes to account for increased risk. Conversely, in more stable markets, they might tighten their entry criteria or focus on shorter time frames for trades.
By remaining flexible and open to change while utilizing TradingView’s analytical capabilities, traders can enhance their chances of sustained success in the ever-evolving landscape of financial markets.
If you are interested in exploring profitable trading strategy ideas, you may want to check out this article on trend following, mean reversion, and breakout trading. This article provides valuable insights into different trading strategies that can be implemented using TradingView. Additionally, if you are looking to automate your trading process, you can also learn more about Pine Script automated bots in this related article. By combining these resources, you can enhance your trading experience and potentially improve your overall trading performance.
FAQs
What is a TradingView strategy?
A TradingView strategy is a set of rules and conditions that a trader can use to automate their trading decisions on the TradingView platform. These strategies can be created using the Pine Script programming language.
How do you create a TradingView strategy?
To create a TradingView strategy, traders can use the Pine Script editor on the TradingView platform. They can define the conditions for entering and exiting trades, as well as any other custom indicators or signals they want to incorporate into their strategy.
Can TradingView strategies be backtested?
Yes, TradingView allows traders to backtest their strategies using historical price data. This allows traders to see how their strategy would have performed in the past and make any necessary adjustments before using it in live trading.
Are TradingView strategies suitable for all types of traders?
TradingView strategies can be suitable for a wide range of traders, from beginners to experienced professionals. However, it’s important for traders to thoroughly test and validate their strategies before using them in live trading, and to understand the risks involved in automated trading.
Can TradingView strategies be used for automated trading?
Yes, TradingView strategies can be used for automated trading through the use of TradingView’s alerts and webhook features, which allow traders to connect their strategies to their brokerage accounts or other trading platforms.
