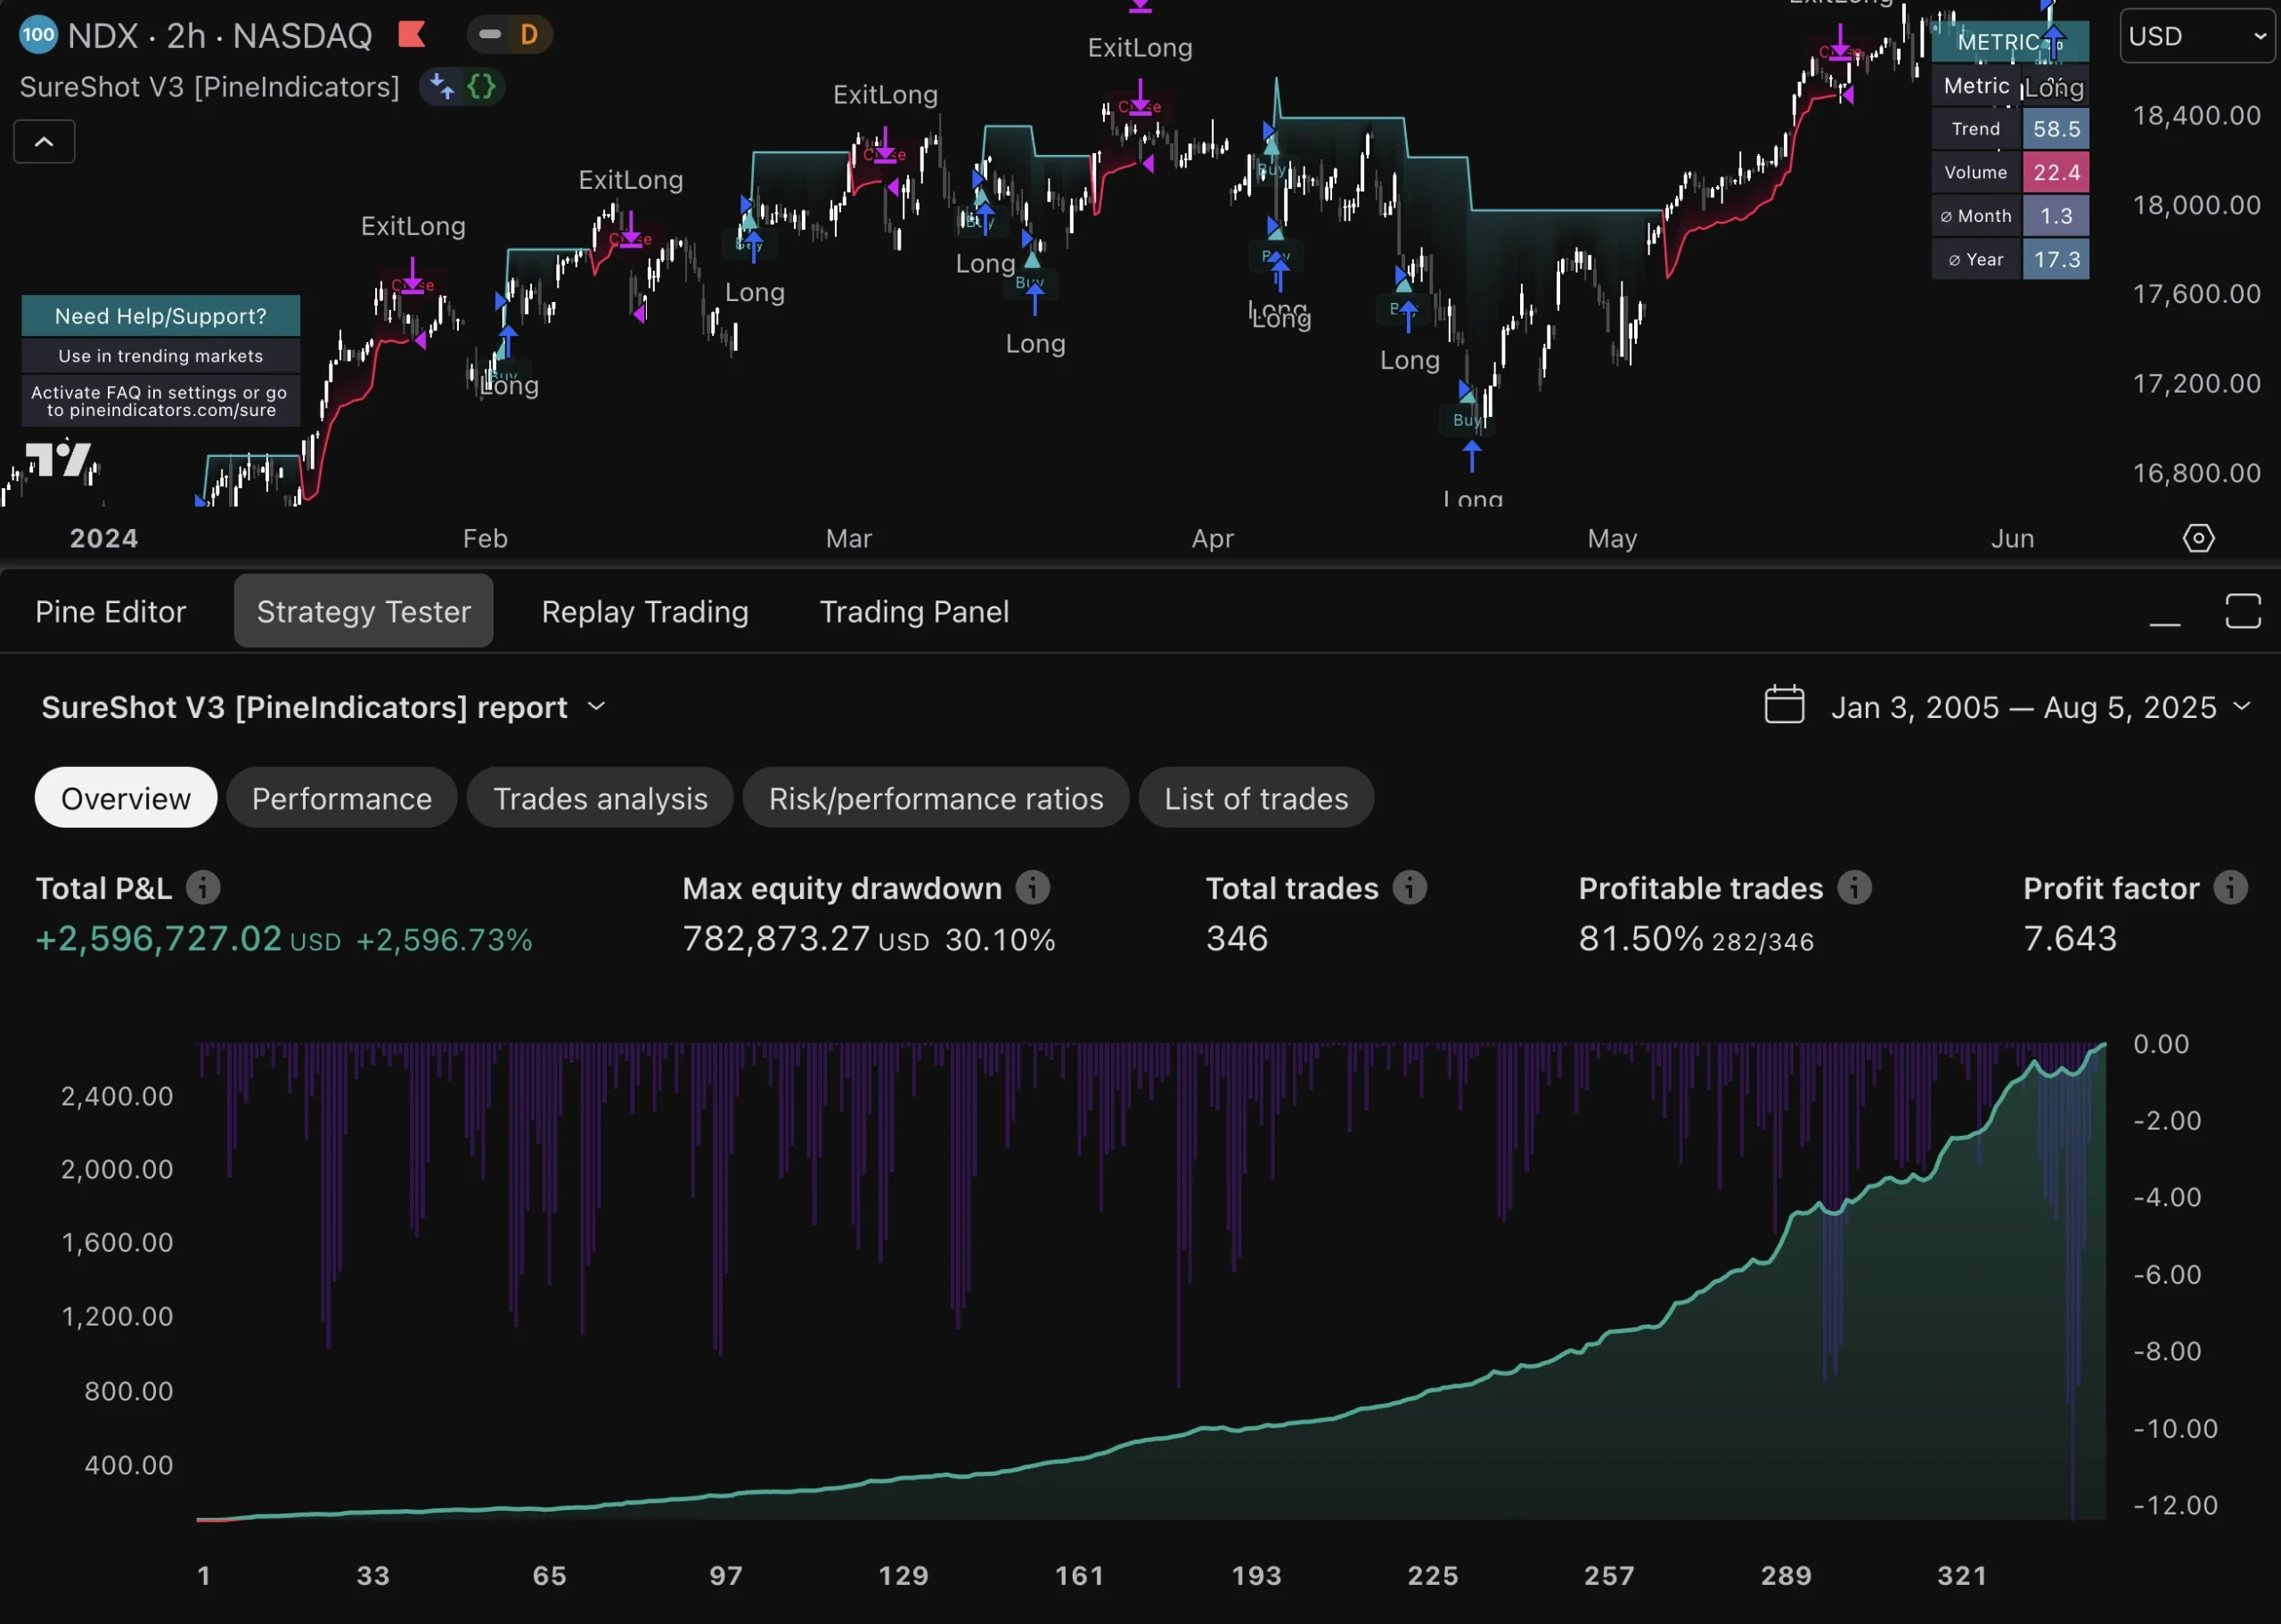
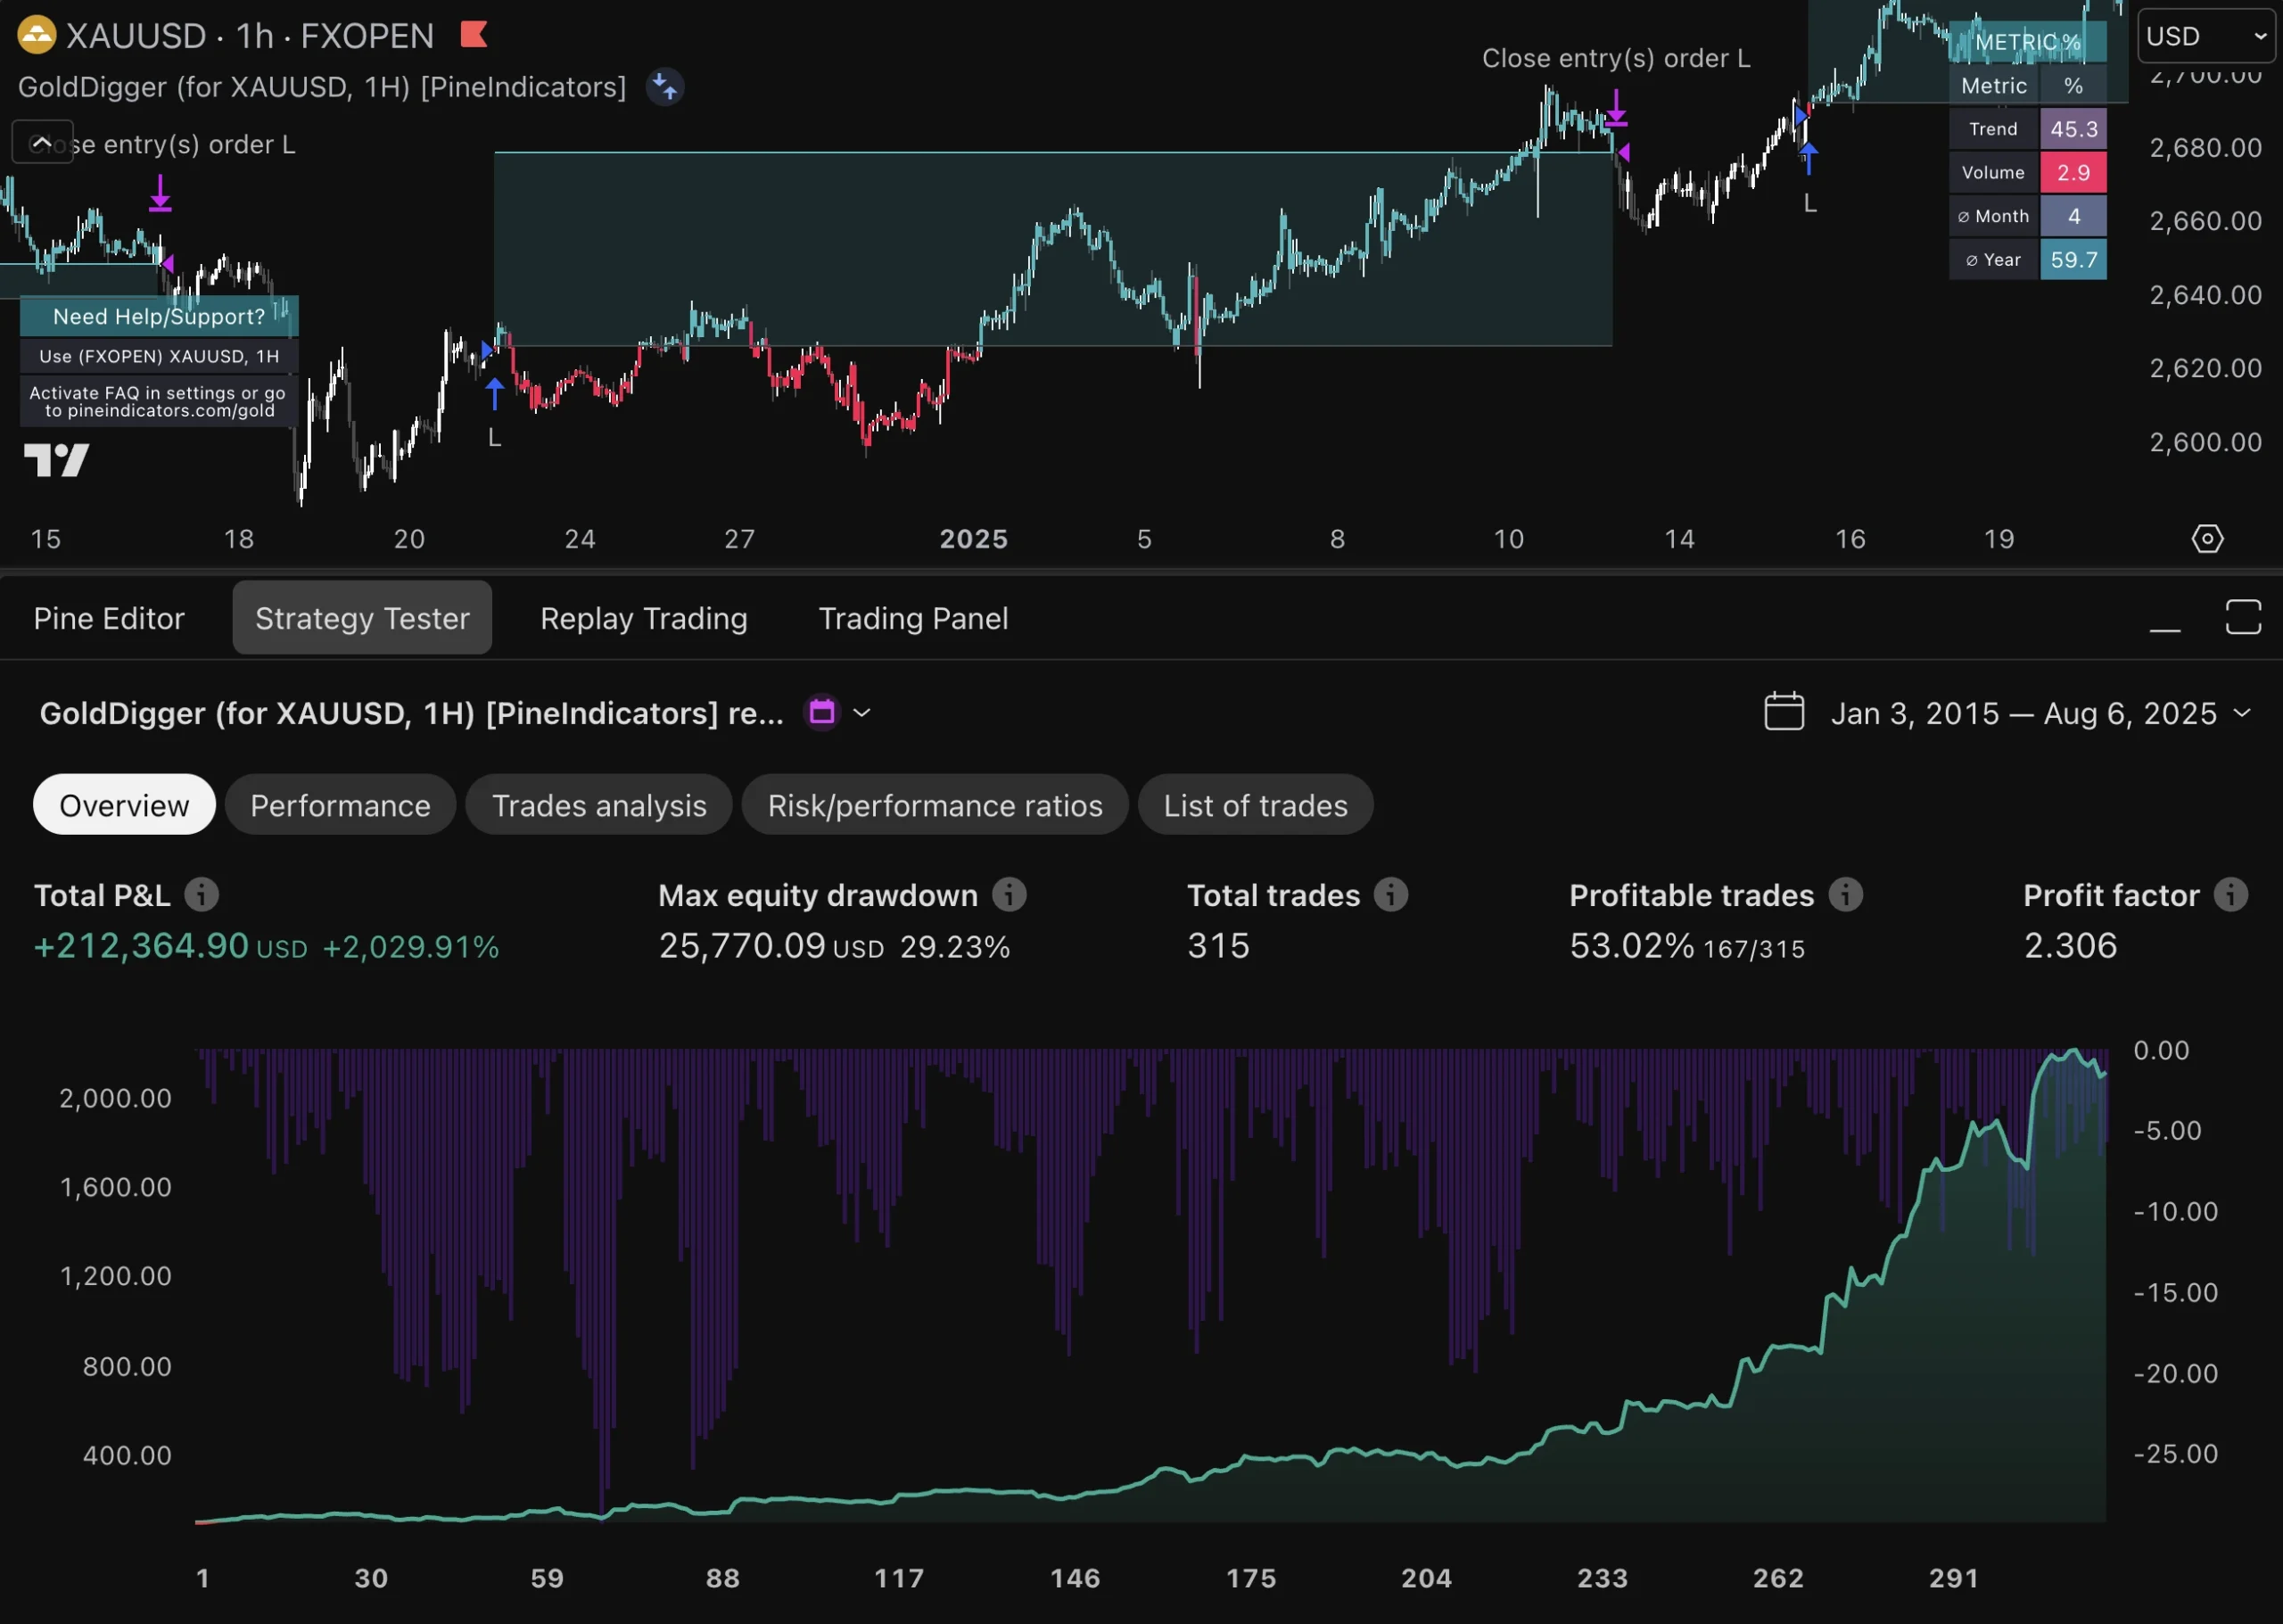
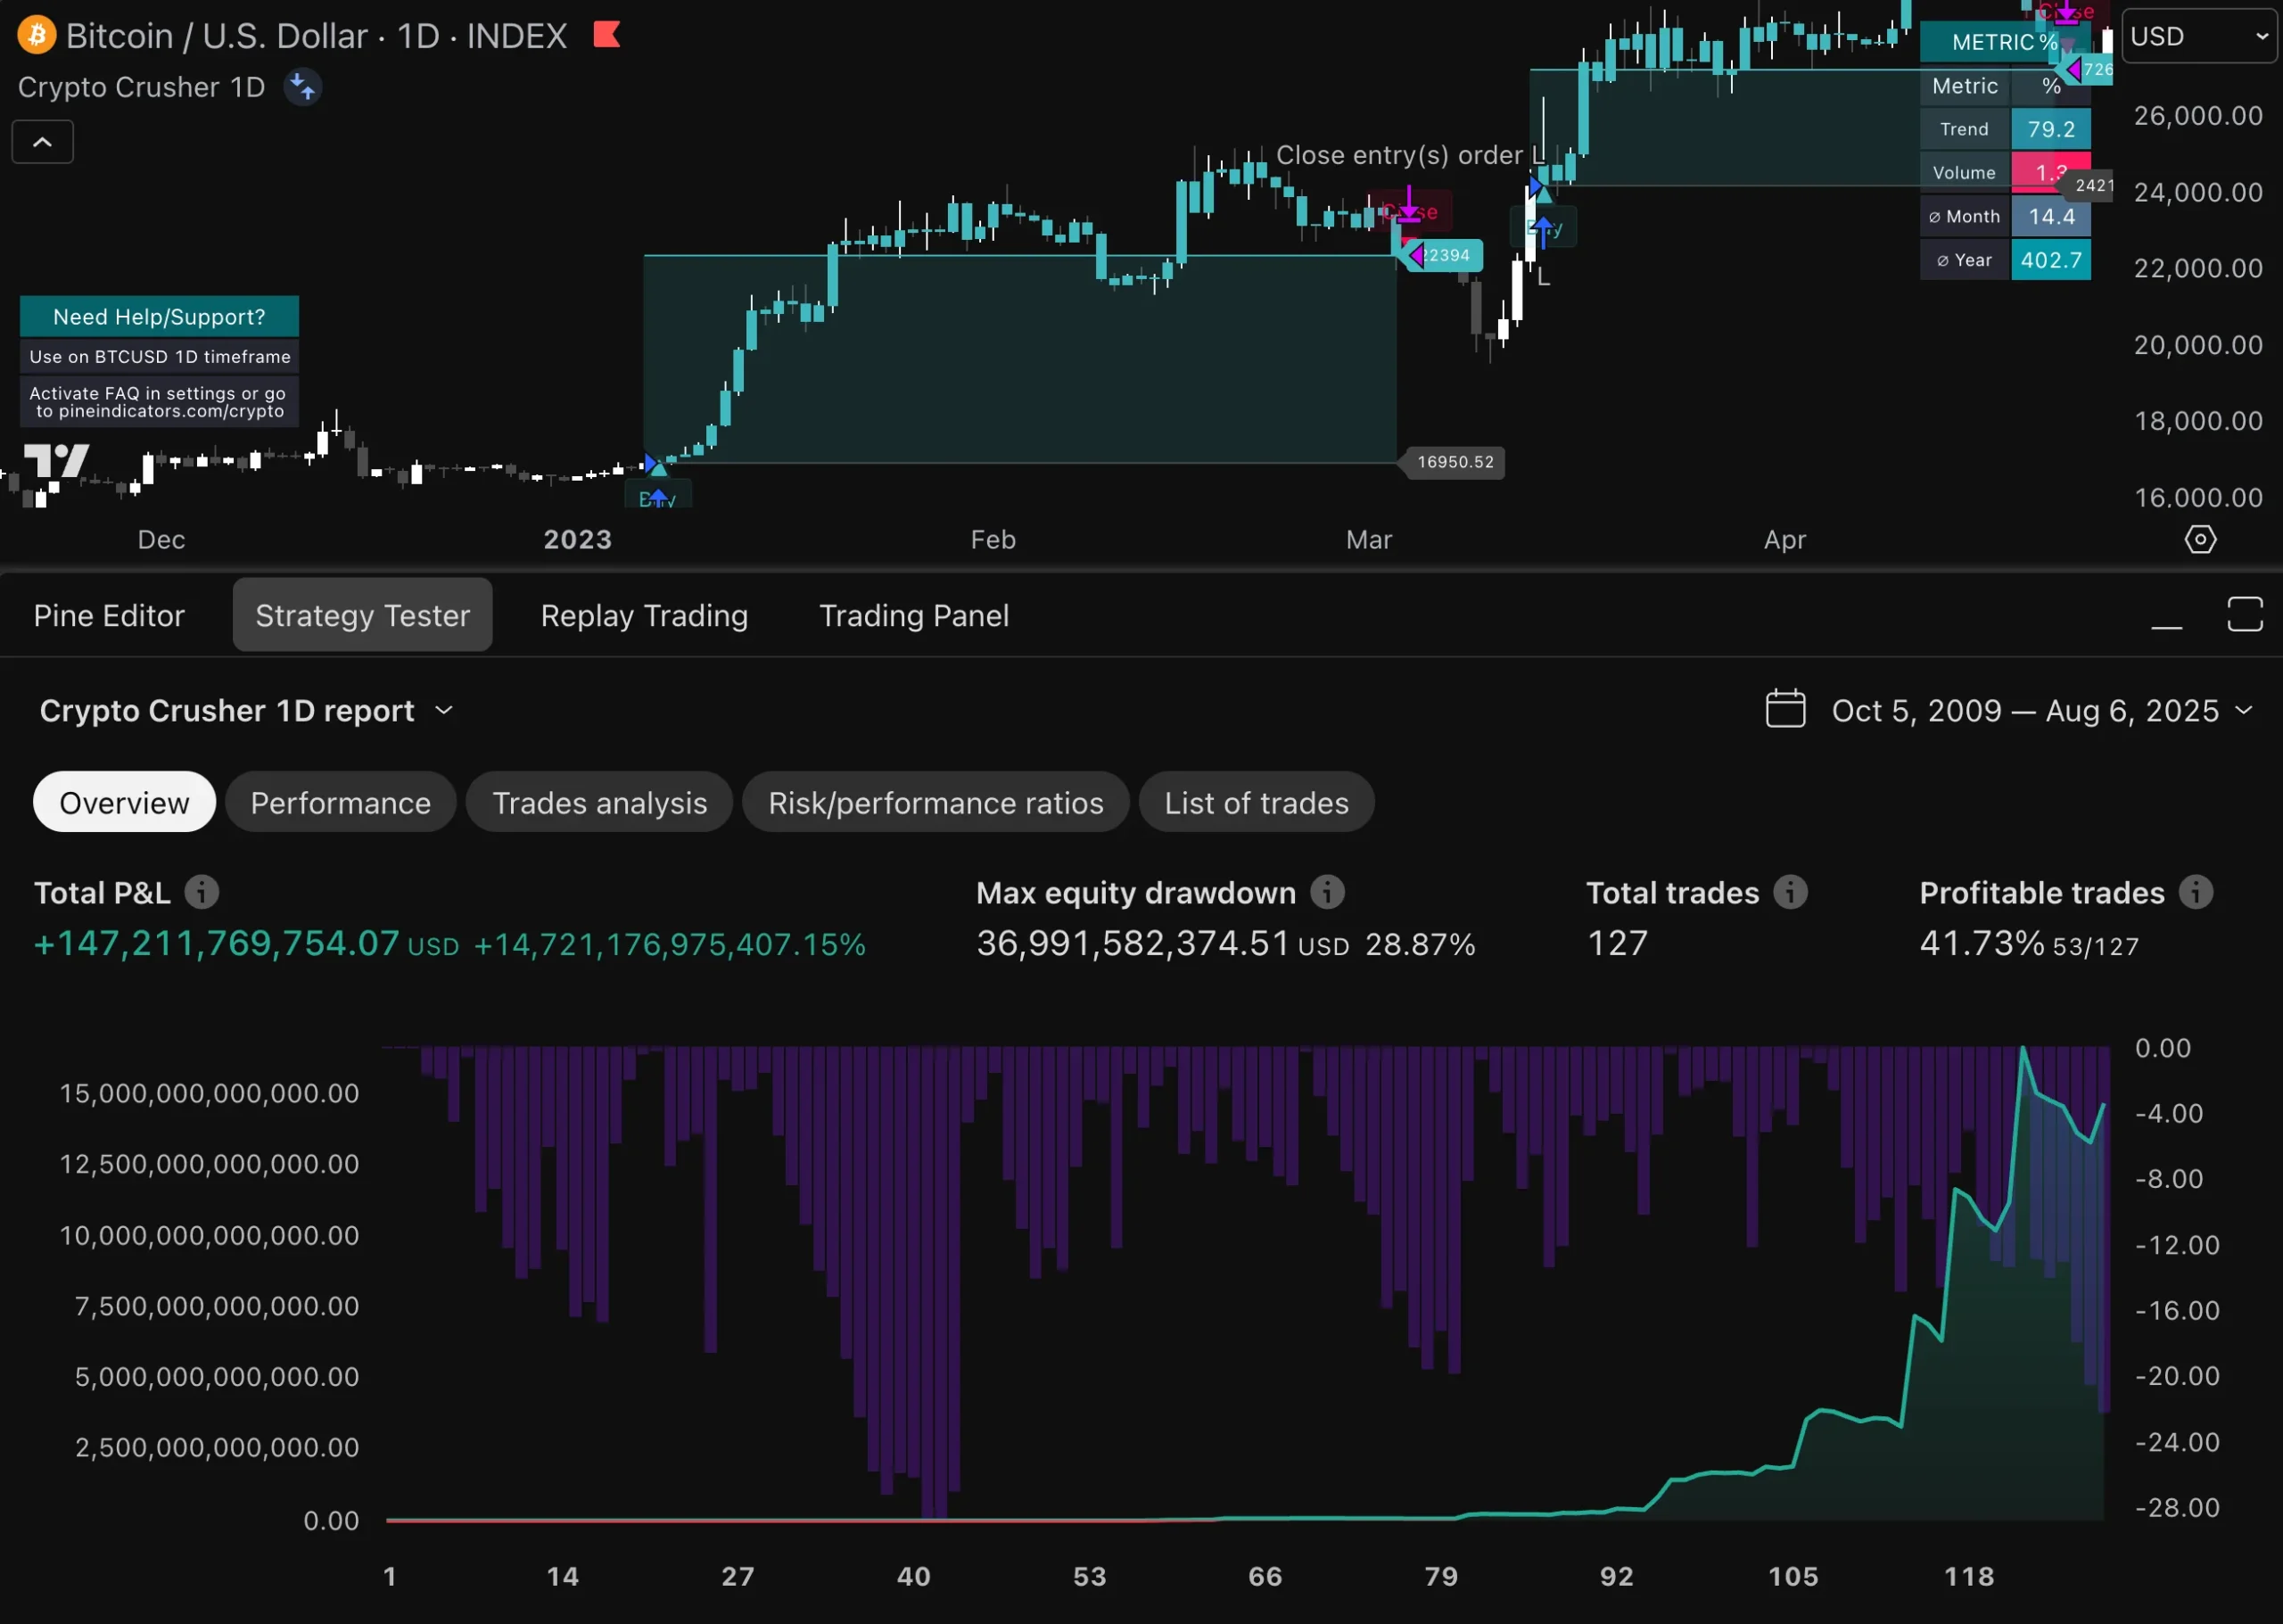
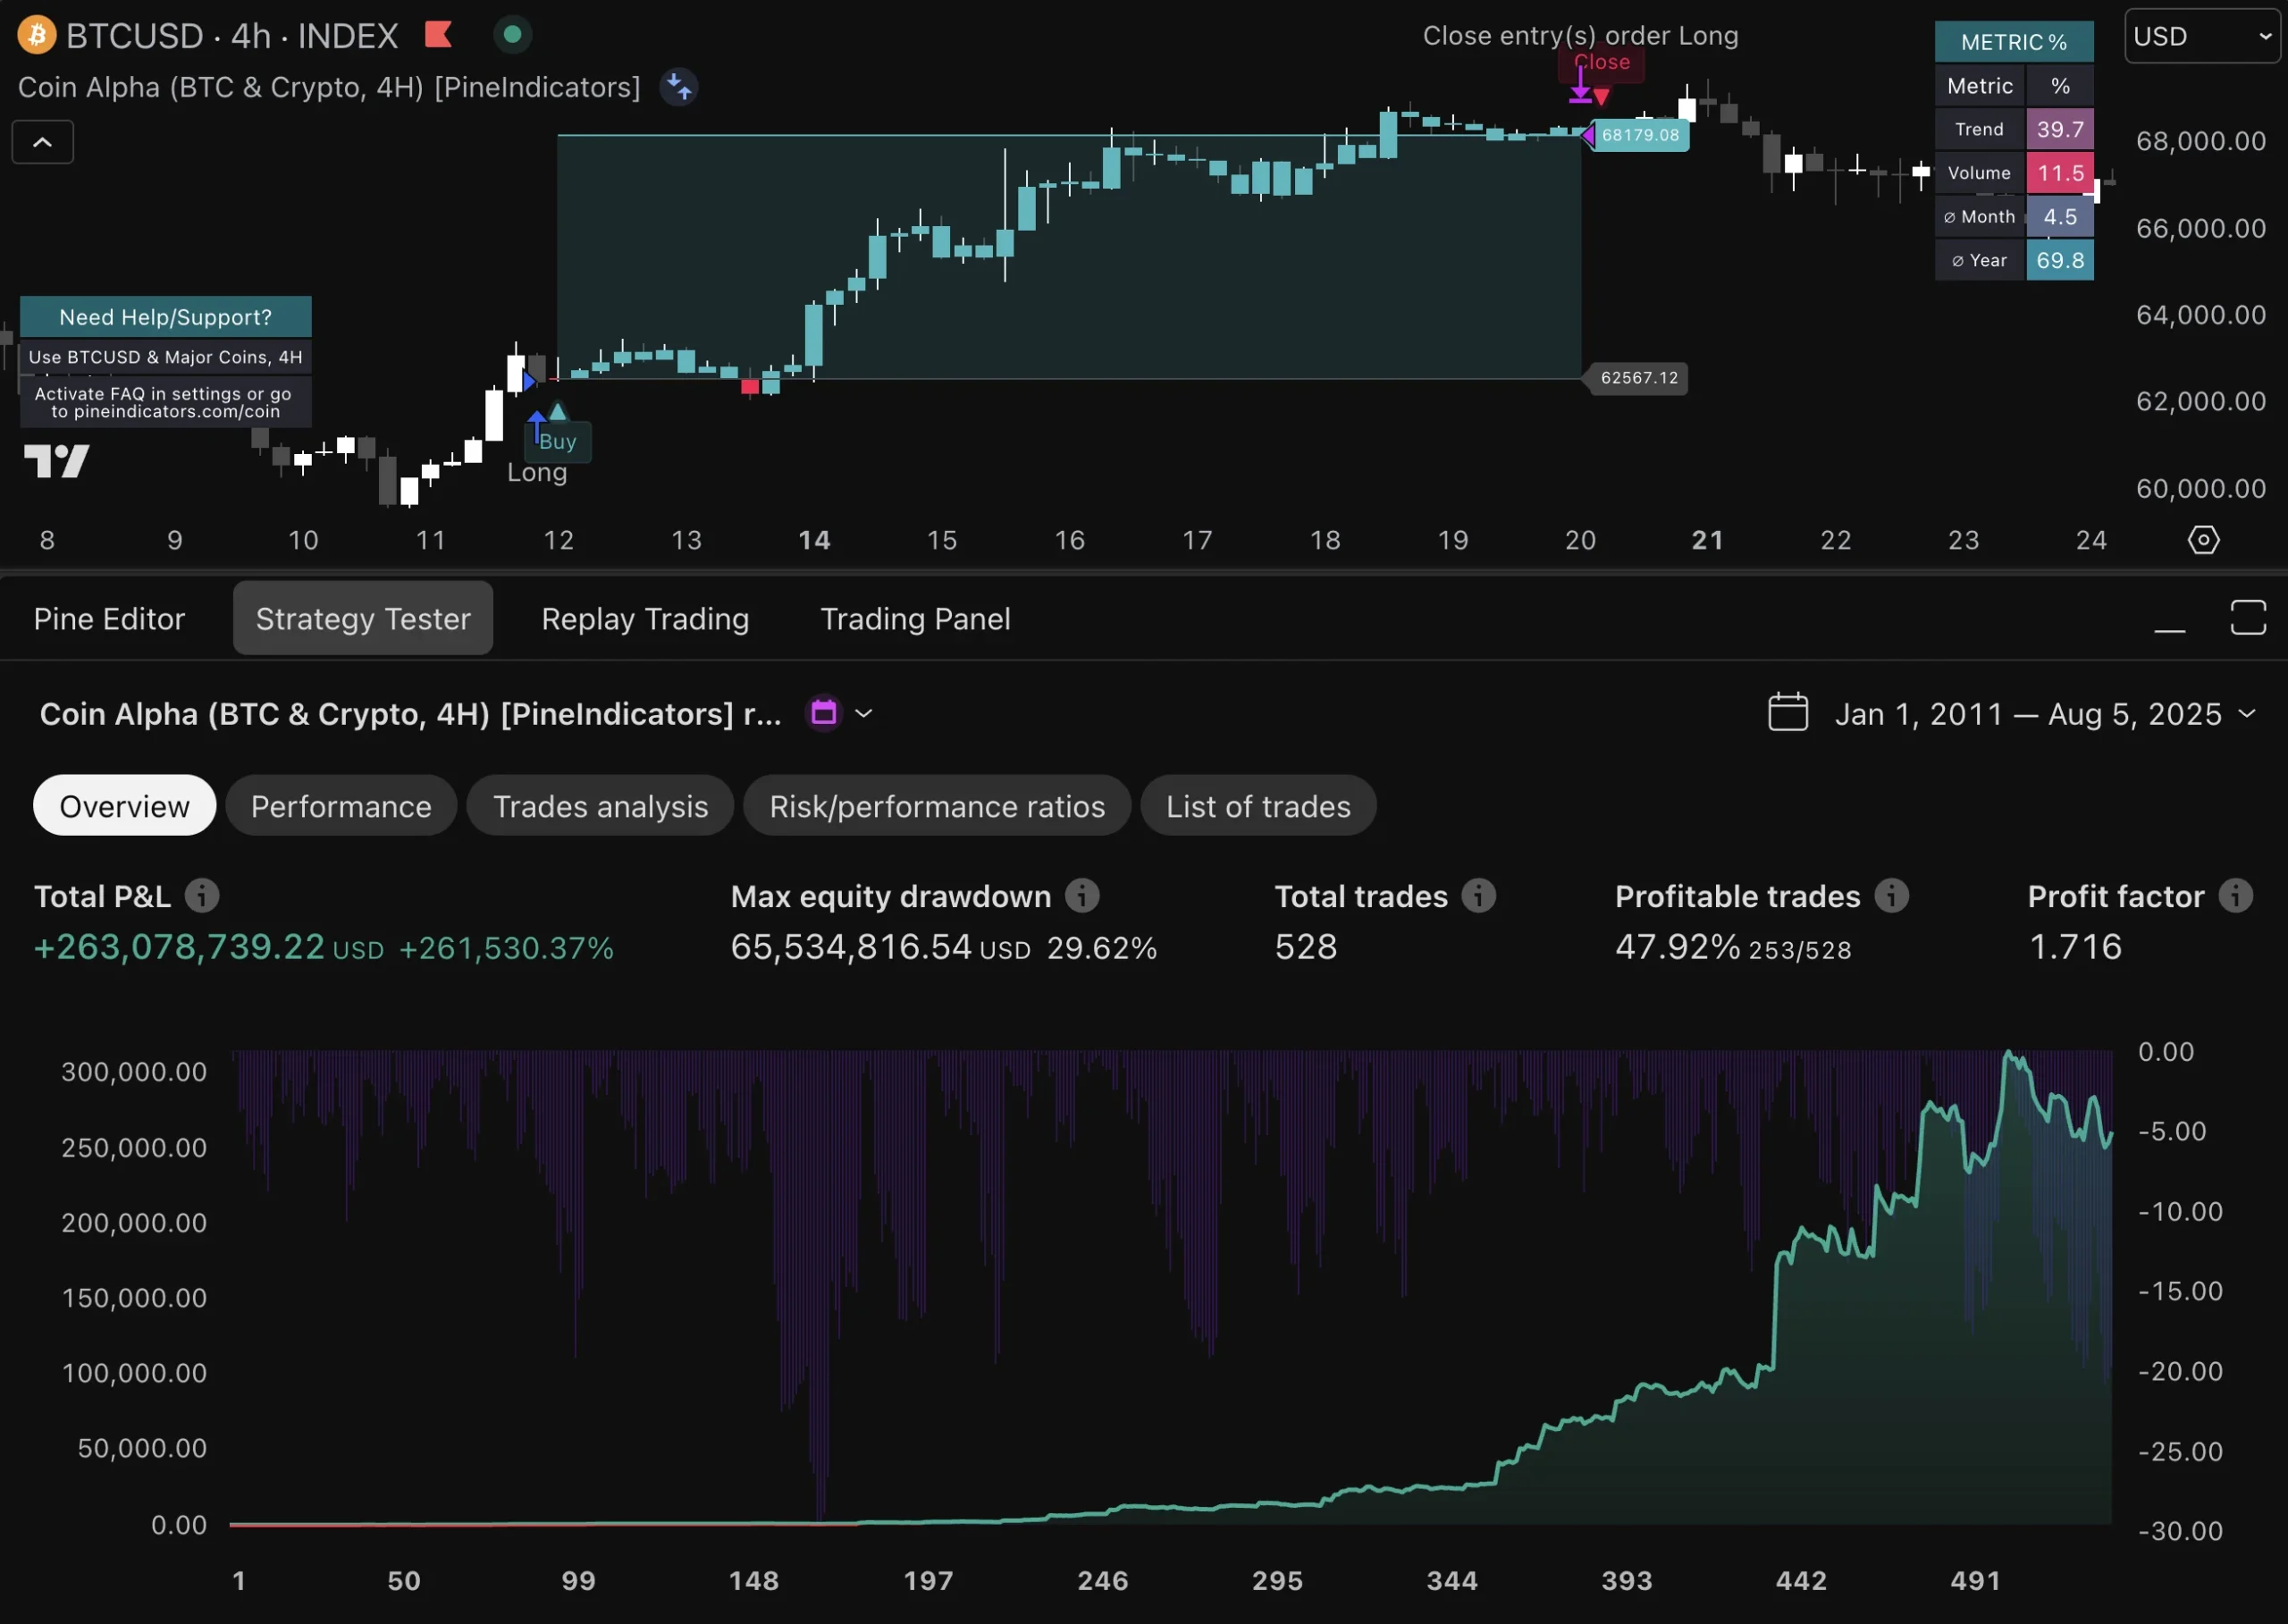
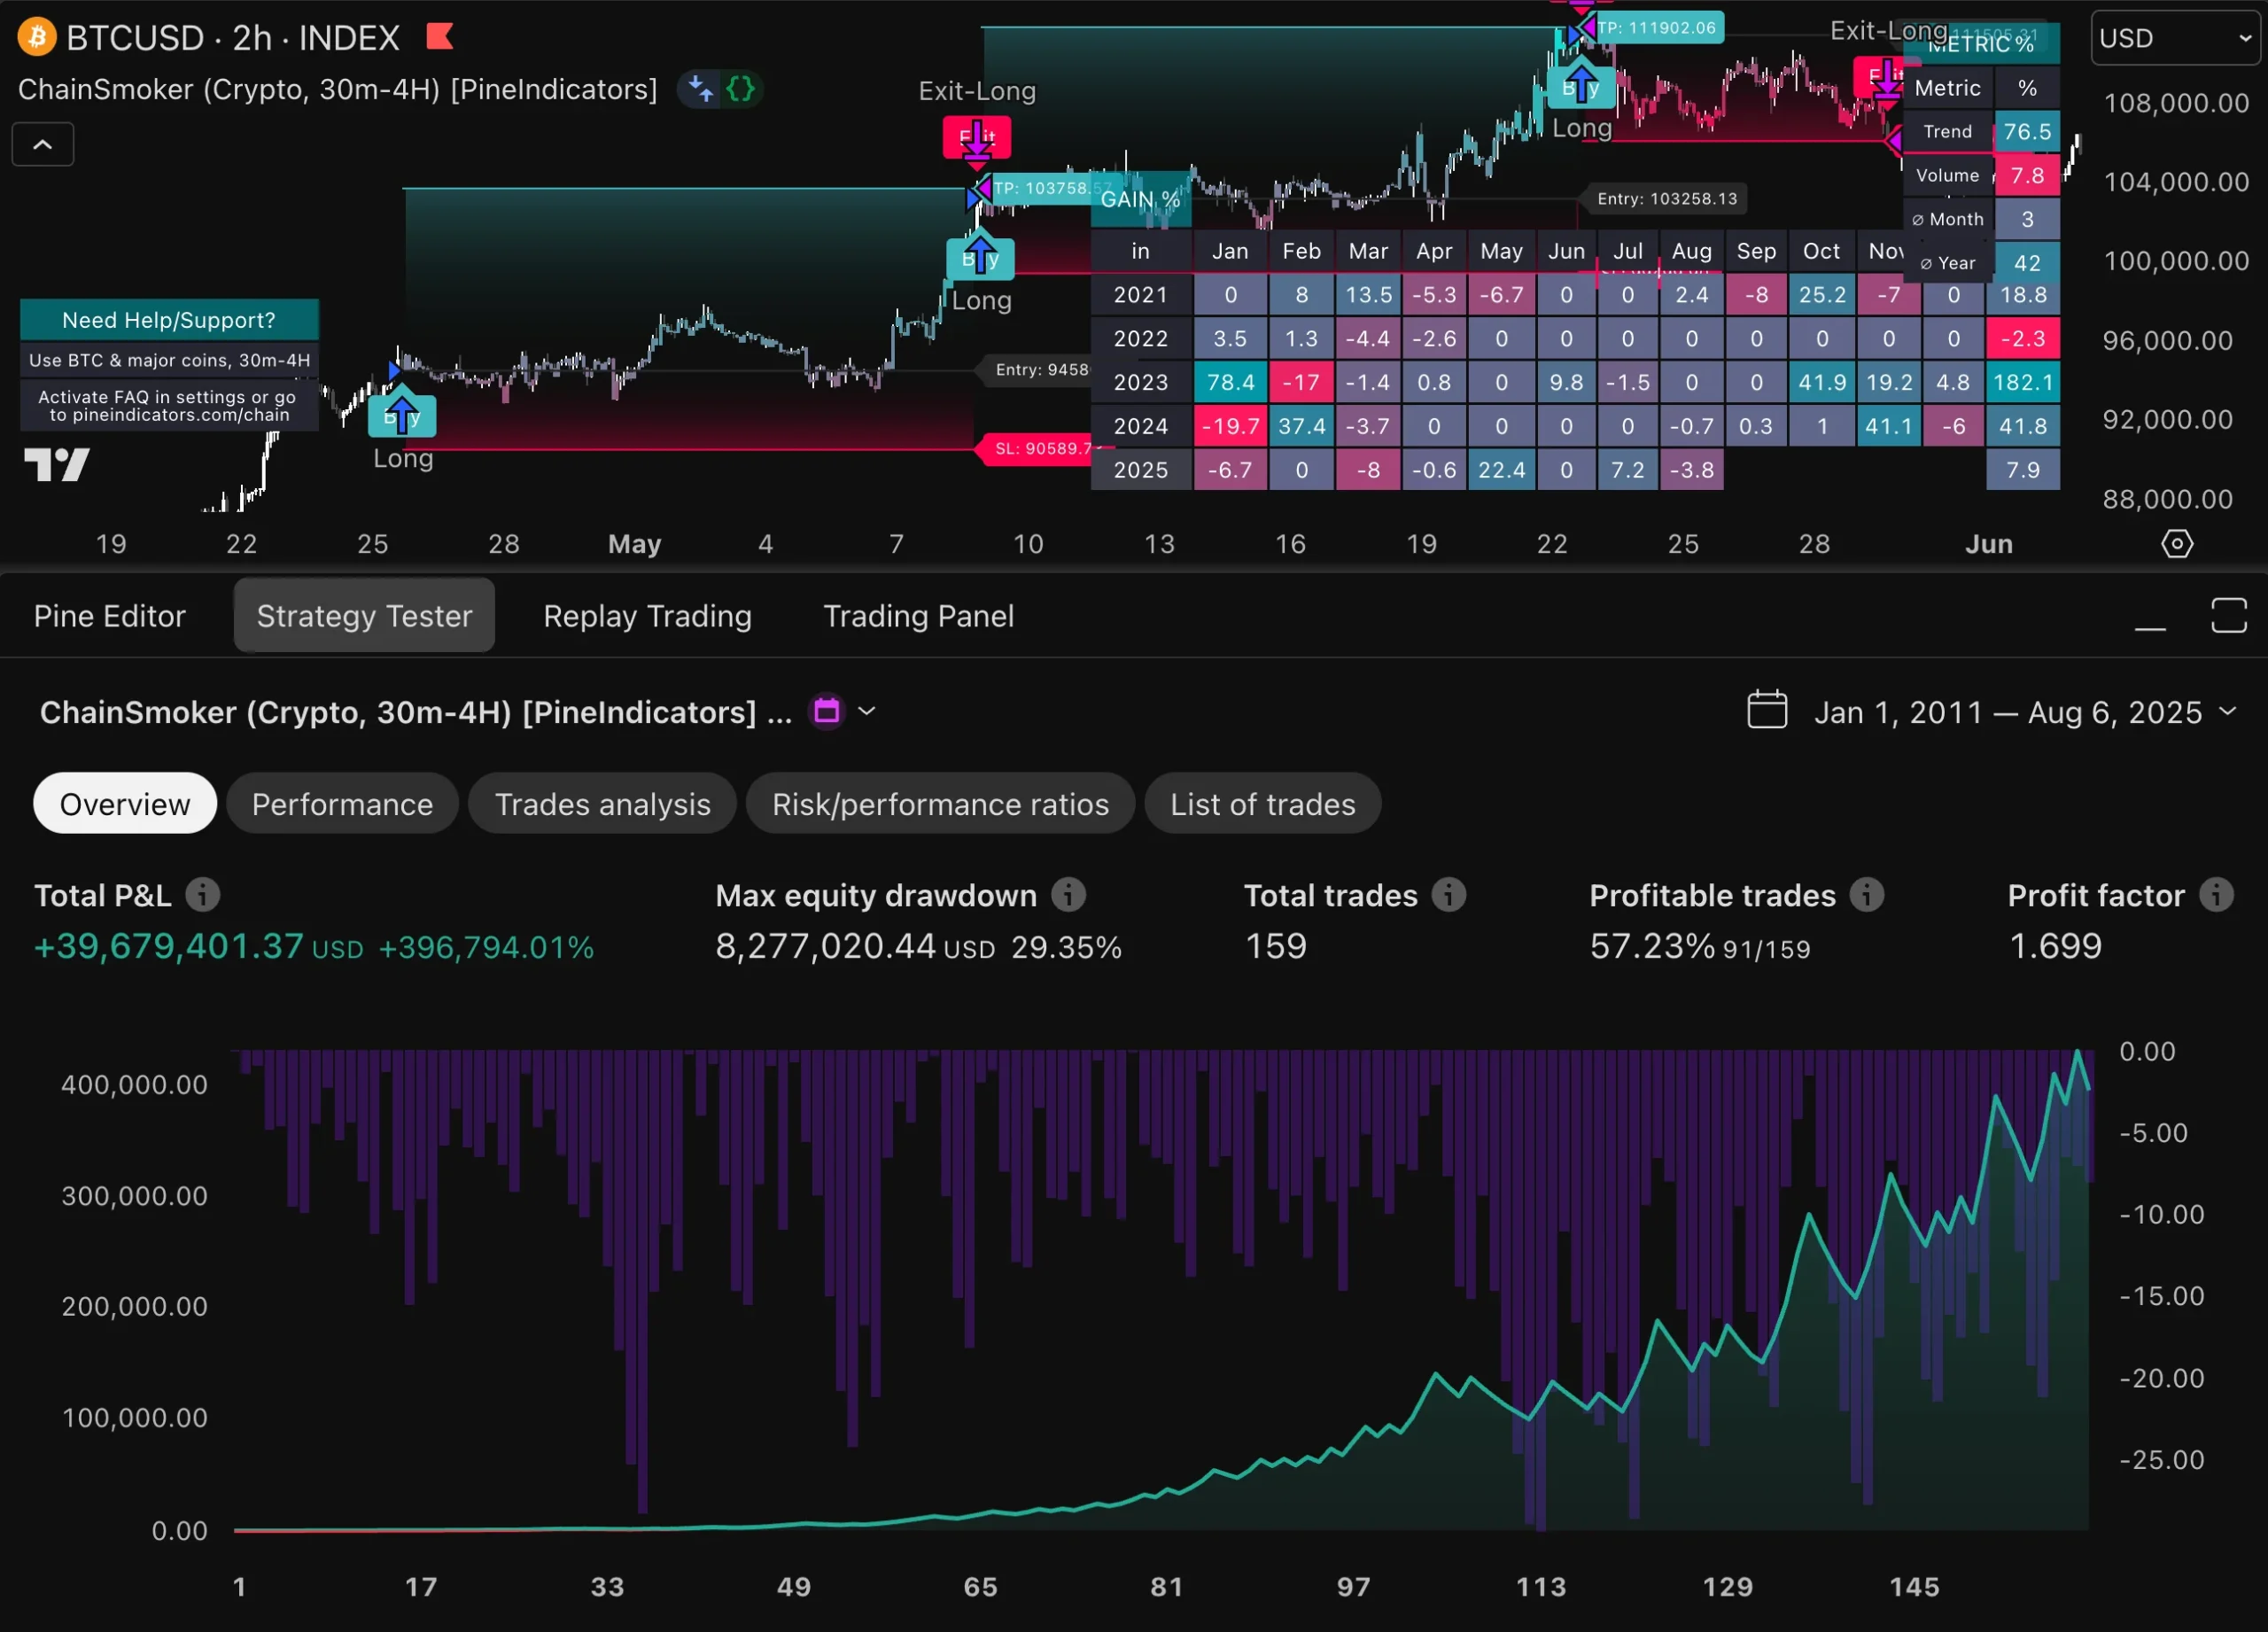
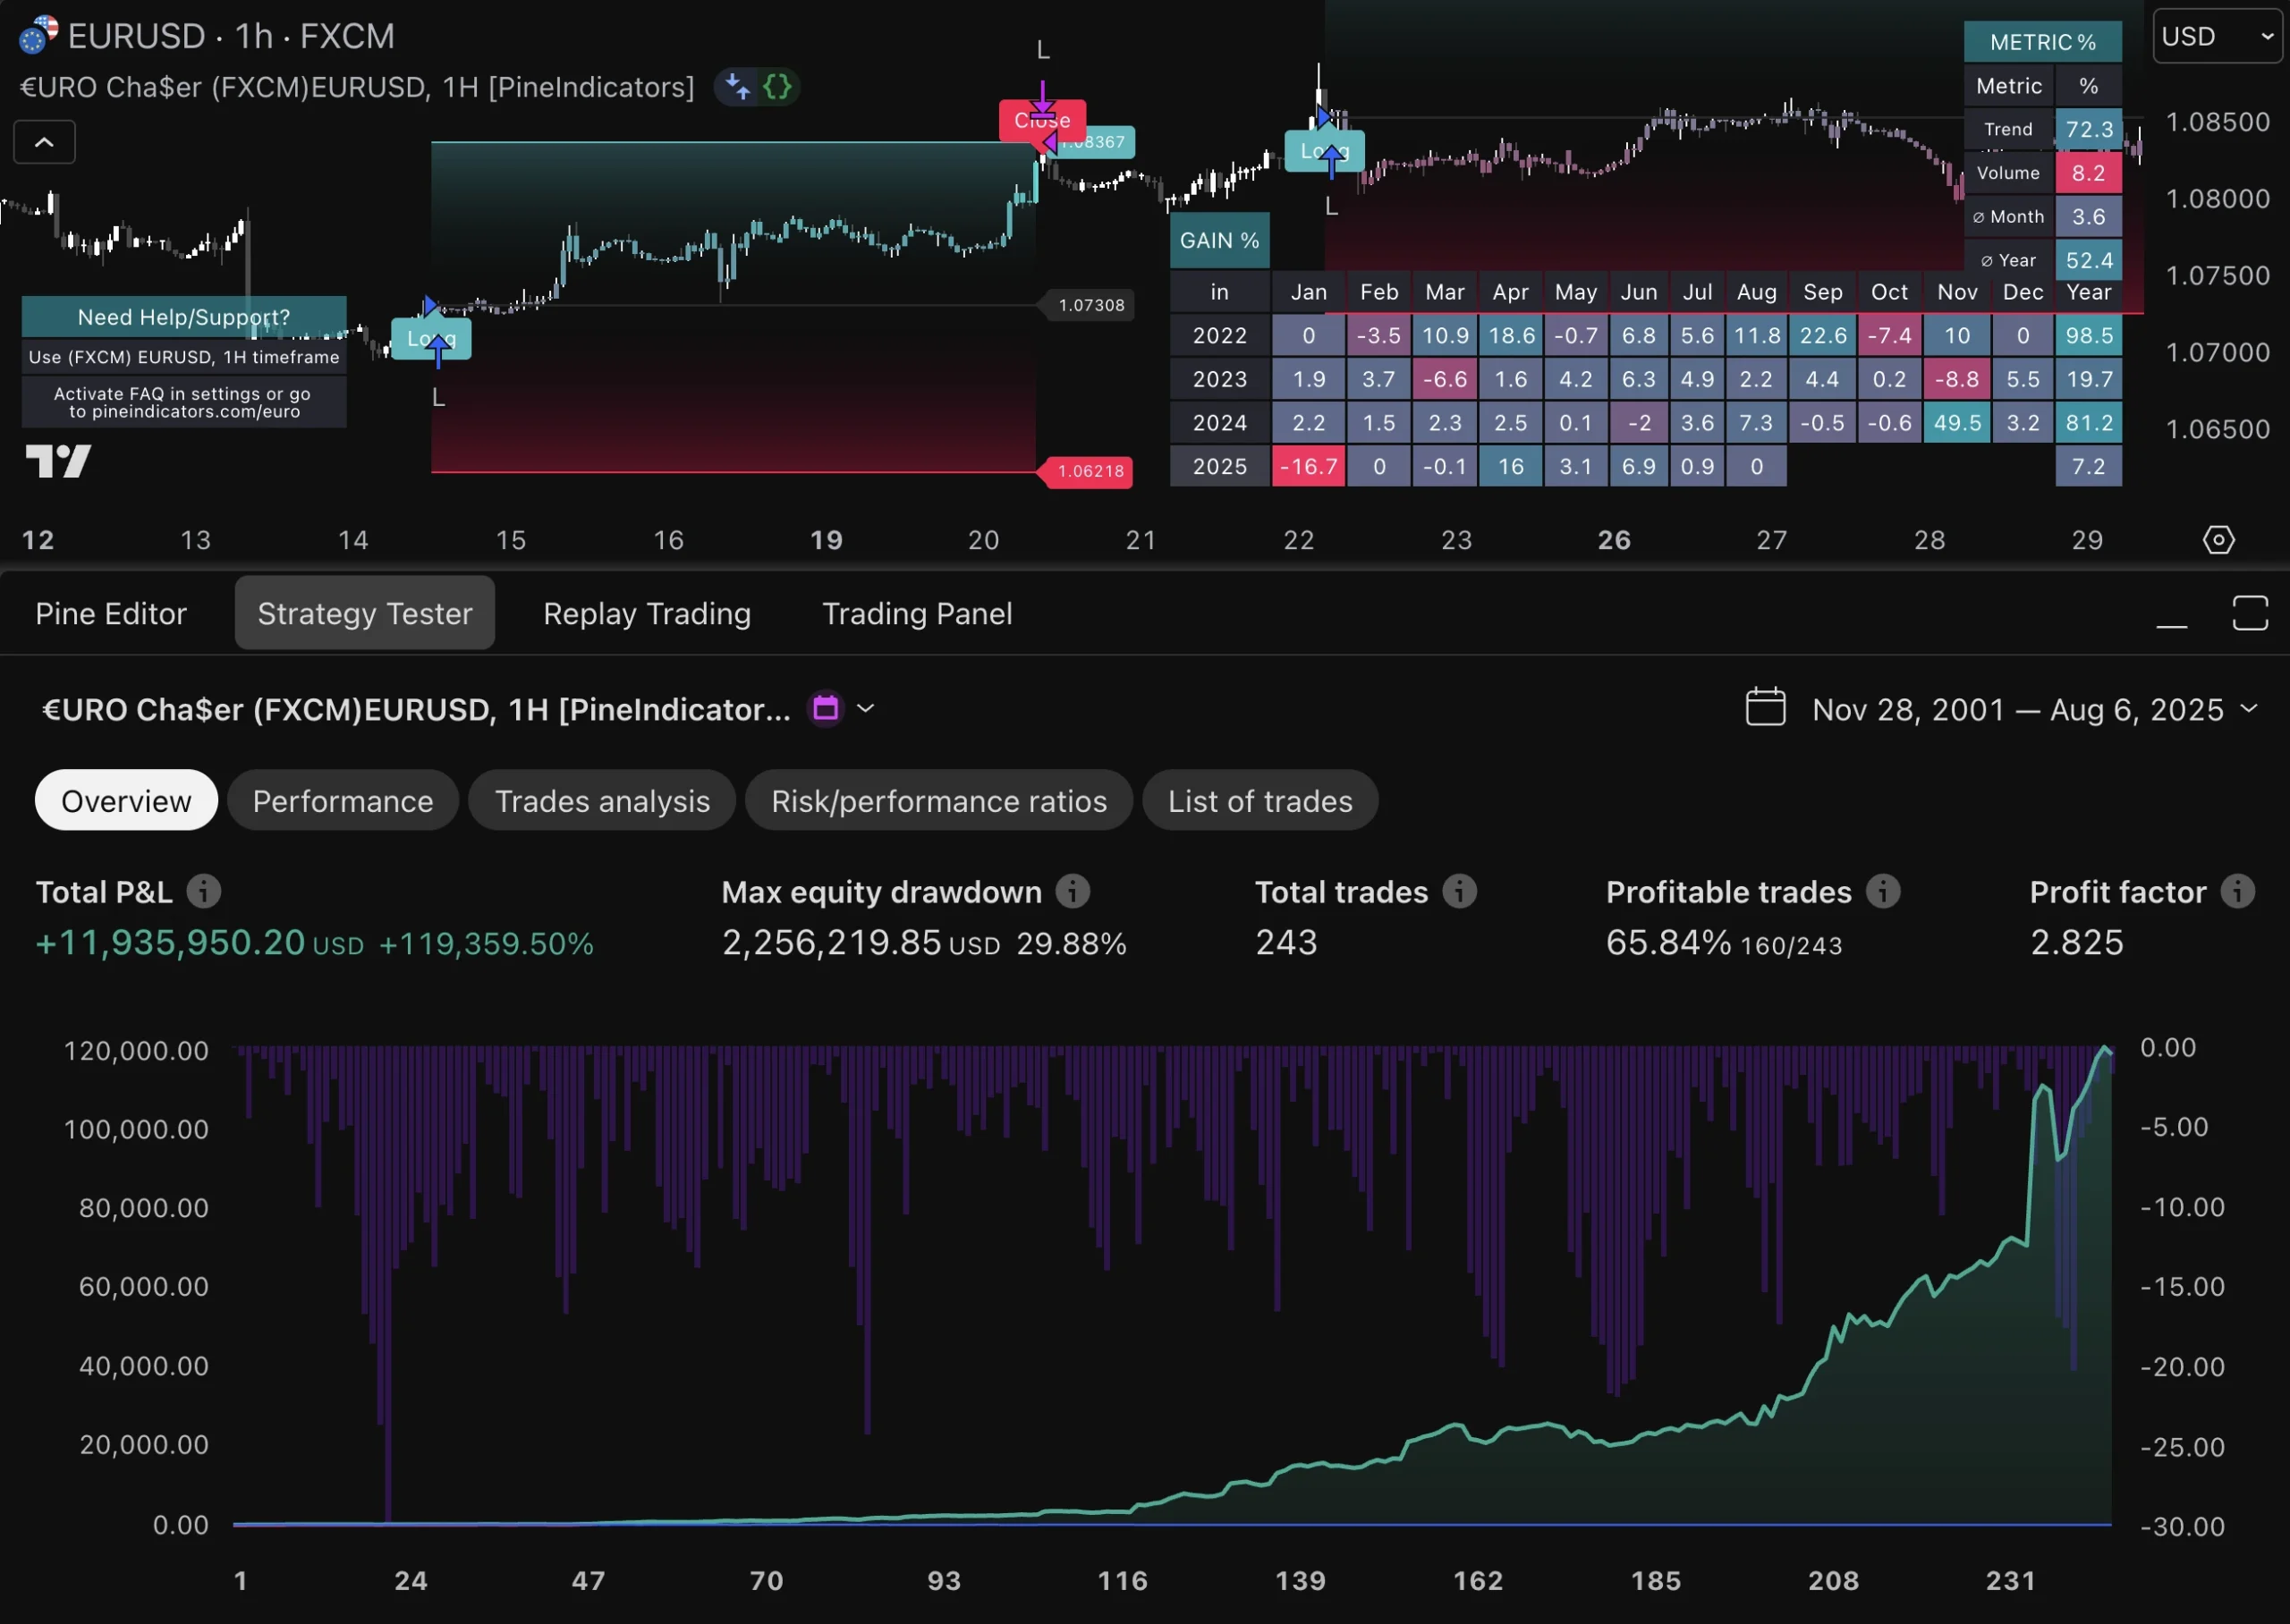
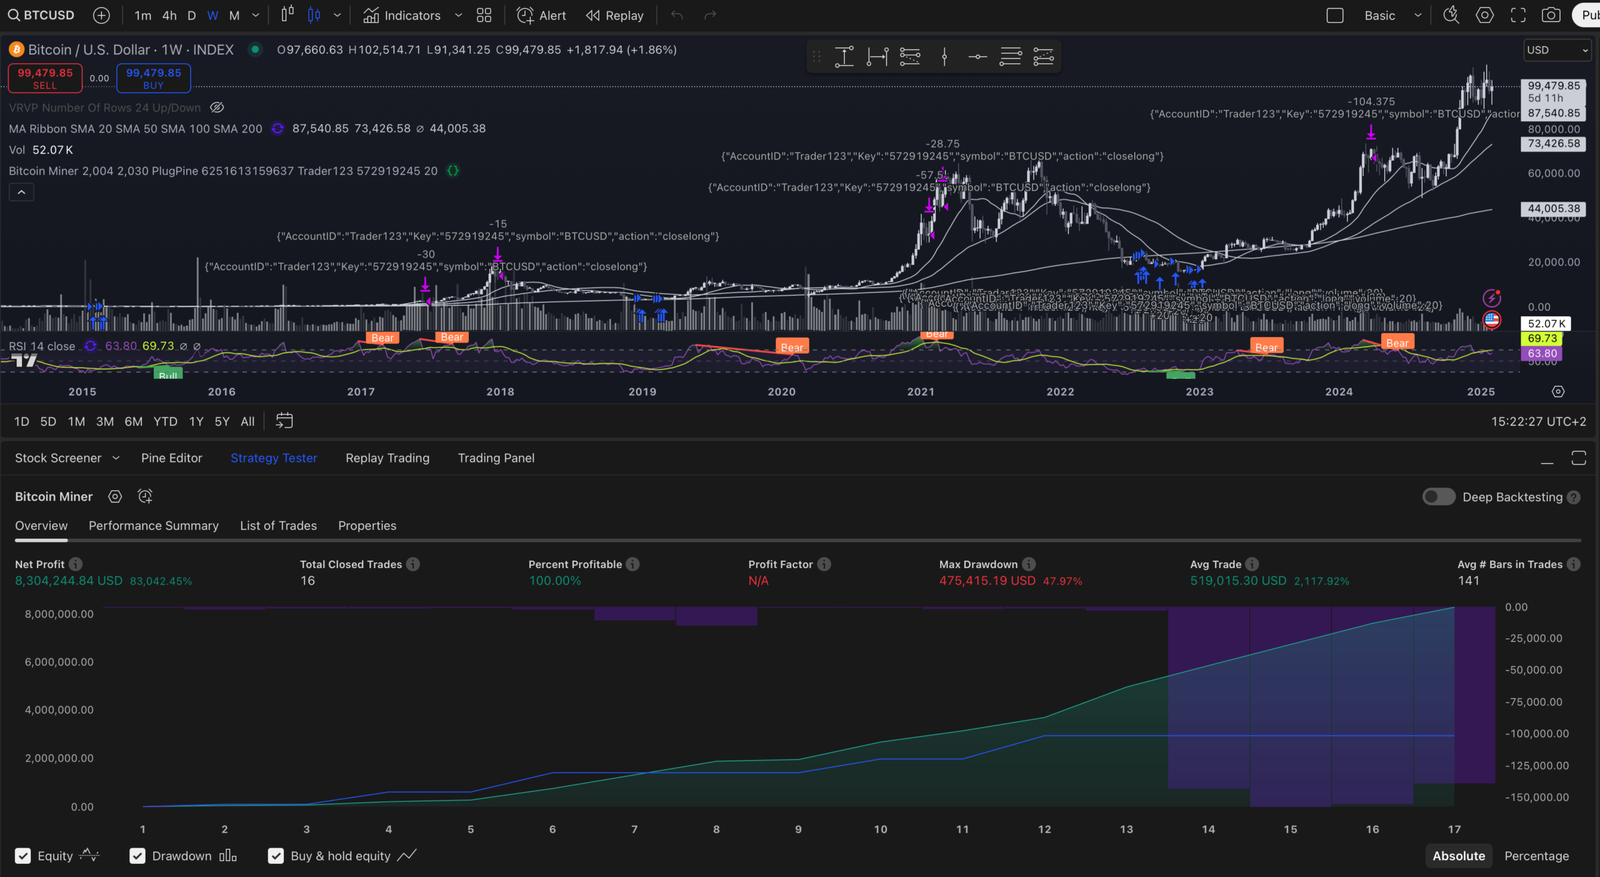
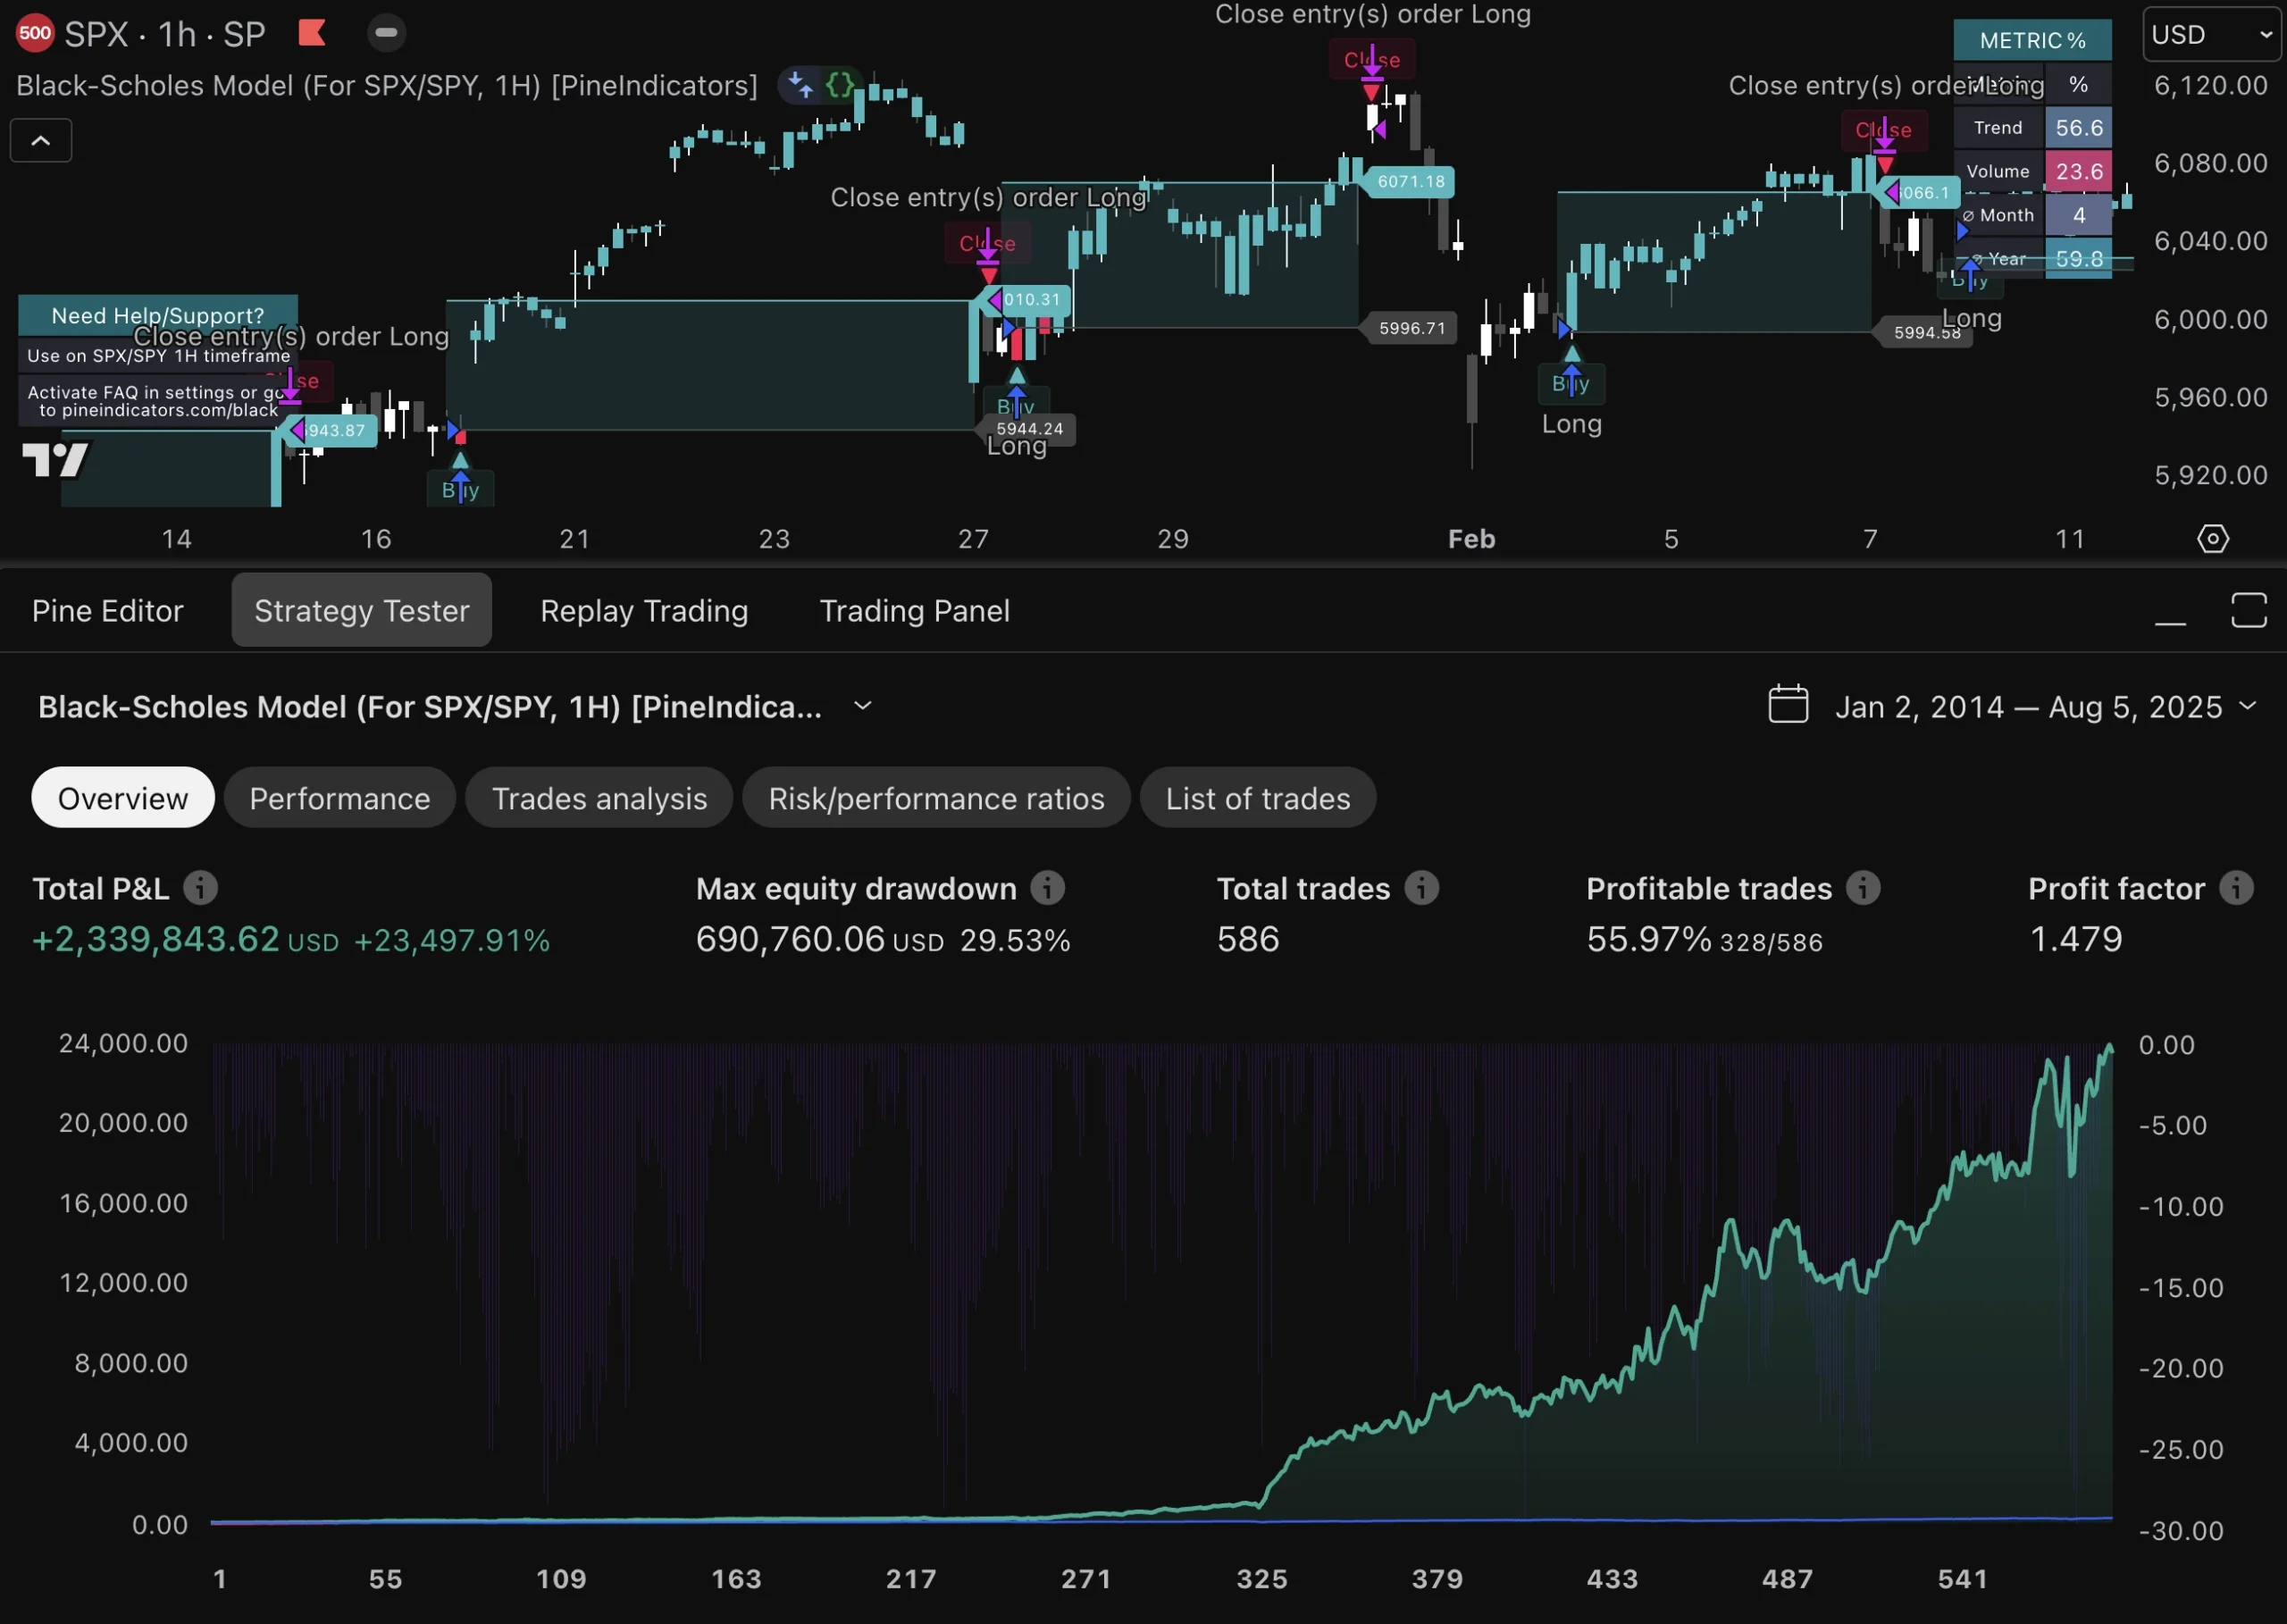
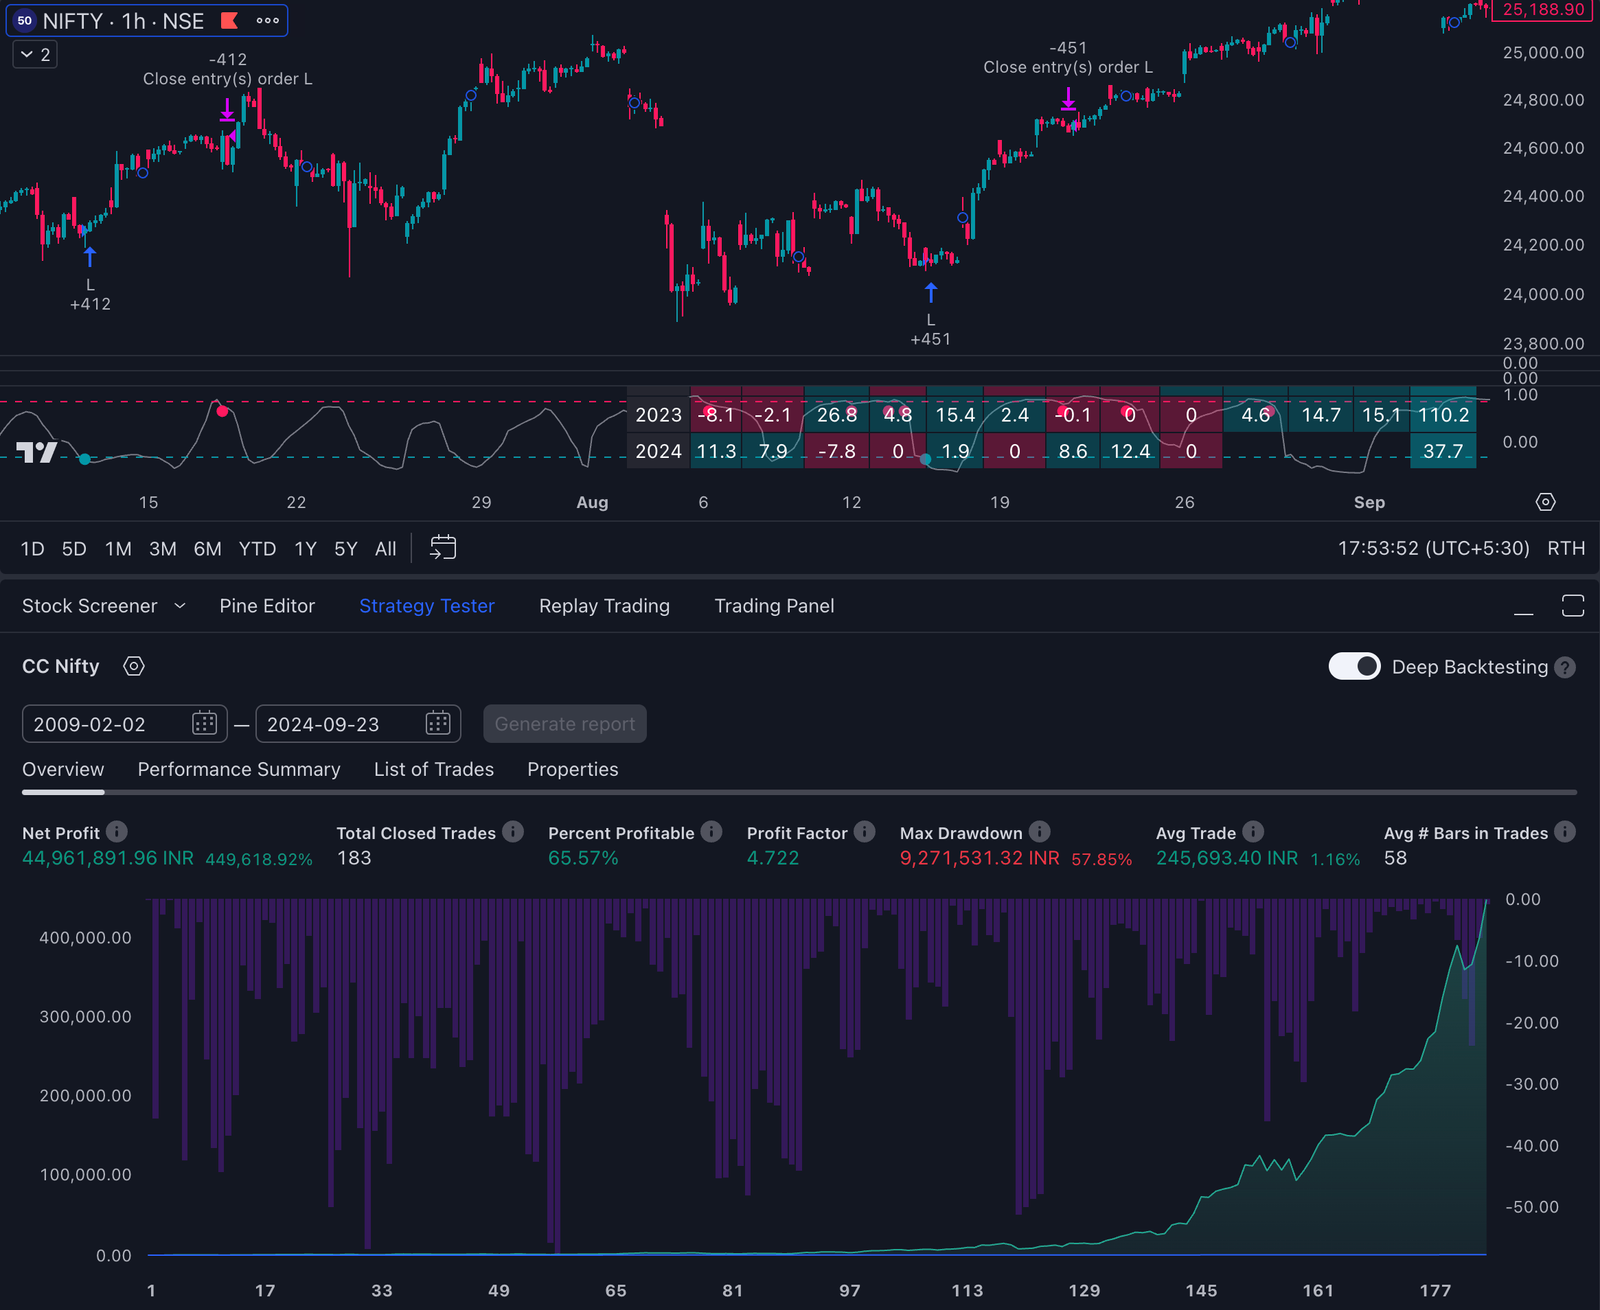
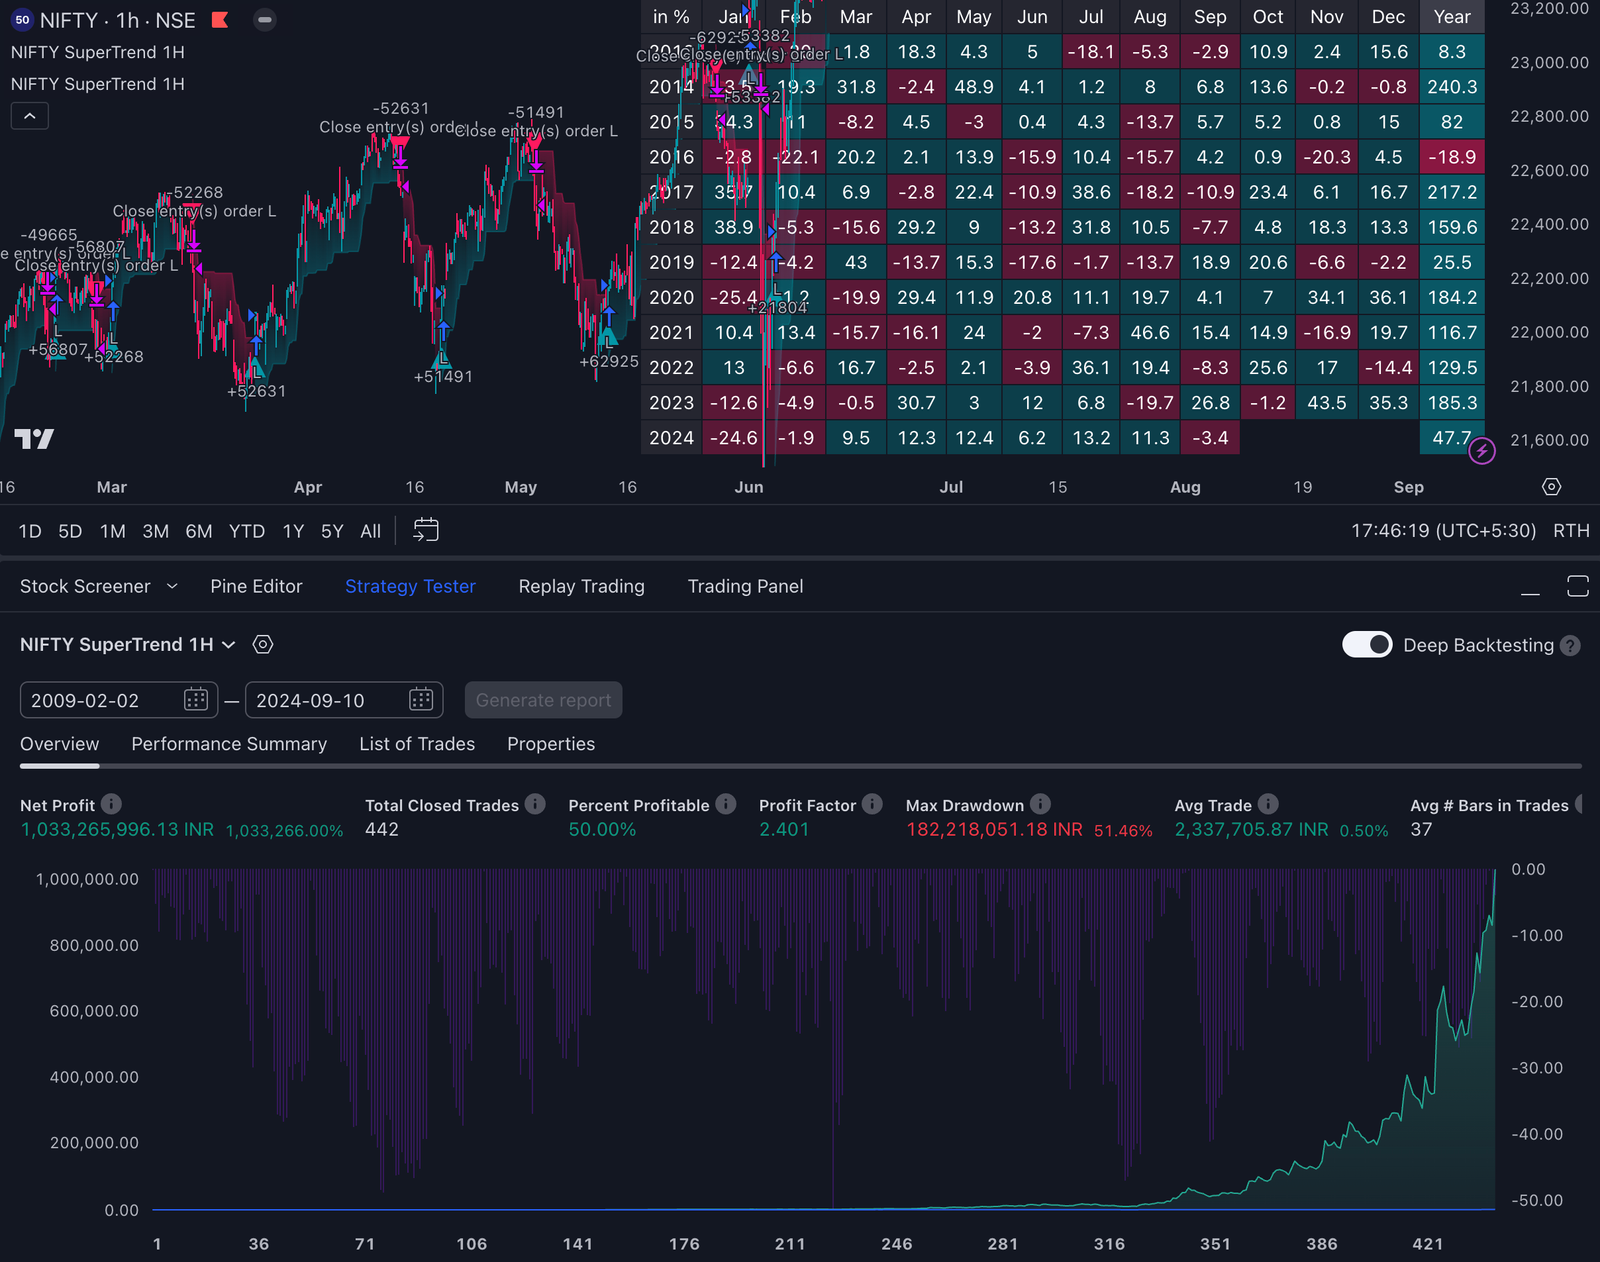
Pine Script is a lightweight programming language developed by TradingView, designed specifically for creating custom indicators and backtesting trading strategies. This scripting language allows traders to tailor their technical analysis tools according to their unique needs, including the development of custom technical indicators, enhancing their ability to make informed decisions in the stock market.
Custom indicators are crucial for traders as they provide personalized insights that standard tools may not offer. By using Pine Script indicators for stocks, you can create bespoke technical analysis tools that align closely with your trading strategies. With advanced Pine Script, traders can develop sophisticated indicators, strategies, and alerts, enabling more complex and powerful trading solutions. This customization leads to better analysis, more precise entry and exit points, and potentially higher profitability.
TradingView plays a key role in the Pine Script ecosystem. As a widely-used charting and social network platform for traders, TradingView provides extensive market data and a collaborative environment across stocks, forex, and other asset classes. Users can publish their Pine Script-created indicators, fostering a community where knowledge is shared freely. Over 100,000 Pine Script publications exist within TradingView, ranging from simple moving averages to complex trend visualization tools.
Using Pine Script on TradingView empowers traders to harness the full potential of custom indicators, making it an invaluable resource in modern stock trading.
Understanding Pine Script
Pine Script is a lightweight programming language created by TradingView, specifically designed for building custom trading indicators and backtesting strategies. Its primary purpose is to empower traders with the ability to develop personalized technical analysis tools tailored to their unique trading styles and requirements. While Pine Script is popular for its user-friendly syntax and accessibility, traders can progress from basic scripts to advanced pine script techniques, enabling the creation of sophisticated trading indicators, multi-timeframe analysis, and even integration with machine learning for deeper market insights. This flexibility allows for customized solutions for technical analysis, highlighting the importance of a structured method for developing and validating indicators.
Key Features of Pine Script
Several features make Pine Script stand out and appeal to traders:
- User-Friendly Syntax: Unlike many other programming languages, Pine Script boasts a simpler and more readable syntax. This allows even those with limited coding experience to write and understand scripts with ease.
- Built-In Error Checking: Pine Script includes built-in error checking and handling capabilities. This feature helps prevent common coding mistakes, making it more accessible for users who might not have extensive programming backgrounds.
- Extensive Market Data Access: Through TradingView’s platform, users can access a vast amount of historical market data. This facilitates effective backtesting of strategies and the creation of various indicators.
- Publishing and Sharing: Pine Script enables users to publish their indicators and trading strategies to the TradingView library. This fosters a collaborative environment where traders can learn from open-source code and share their own innovations.
- Integrated Development Environment (IDE): TradingView provides an integrated development environment for Pine Script, making it convenient for users to write, test, and debug their scripts within the same platform.
Why Traders Prefer Pine Script
The combination of user-friendly syntax, robust error-checking mechanisms, and seamless integration with TradingView makes Pine Script particularly attractive for traders. It lowers the barrier to entry for non-programmers, allowing more individuals to benefit from custom indicators. Additionally, by providing a straightforward way to backtest strategies using historical data, Pine Script helps traders refine their approaches before applying them in live markets.
Pine Script’s features contribute significantly to its popularity among traders seeking customized solutions for technical analysis. With its ease of use and comprehensive support within the TradingView ecosystem, it’s no wonder that many traders turn to Pine Script for developing their personalized trading tools.
Advantages of Using Pine Script for Stock Indicators
offers numerous benefits that make it an appealing choice for creating stock indicators, especially for traders who may not have extensive programming experience. In addition, Pine Script supports the development of complex strategies, enabling advanced traders to design and implement sophisticated trading techniques.
Accessibility for Non-Programmers
One of the standout features of Pine Script is its accessibility. The language is designed to be user-friendly, with a simpler and more readable syntax compared to many other programming languages. This makes it easier for non-programmers to:
- Write and understand custom scripts.
- Develop personalized technical analysis tools.
- Adapt pre-existing scripts to better fit their trading strategies.
The built-in error checking and handling capabilities also ensure that even beginners can quickly identify and fix issues within their code.
Backtesting Strategies with Historical Data
Another significant advantage is the ability to backtest trading strategies using historical market data. This feature allows you to:
- Evaluate the performance of your strategies over past market conditions.
- Identify potential strengths and weaknesses in your trading approach.
- Make data-driven decisions to refine and optimize your strategies.
Backtesting helps you gain confidence in your indicators before deploying them in live trading environments, reducing the risk associated with untested strategies.
Key Benefits Summarized
- User-Friendly Syntax: Simplifies the scripting process.
- Built-In Error Checking: Enhances ease of debugging.
- Comprehensive Backtesting: Facilitates robust strategy evaluation.
With Pine Script, traders can bridge the gap between idea conceptualization and practical implementation, enabling a more personalized and effective approach to stock trading.
Popular Pine Script Indicators for Stocks
1. Moving Averages in Pine Script
Moving averages are among the most popular indicators used in stock trading due to their simplicity and effectiveness in trend analysis. They help traders smooth out price data over a specified period, making it easier to identify trends and potential reversals.
Simple Moving Average (SMA)
The Simple Moving Average (SMA) calculates the average of a set number of closing prices. It is straightforward and provides a clear view of the market trend.
Example: To calculate a 10-day SMA, you add up the closing prices of the last 10 days and divide by 10.
pine //@version=4 study(“Simple Moving Average”, shorttitle=”SMA”, overlay=true) length = input(10, minval=1, title=”Length”) sma = sma(close, length) plot(sma, title=”SMA”, color=color.blue)
Exponential Moving Average (EMA)
The Exponential Moving Average (EMA) gives more weight to recent prices, making it more responsive to new information. This characteristic makes EMA particularly useful for identifying short-term trends.
Example: An EMA with a period of 10 will react faster to price changes compared to an SMA with the same period.
pine //@version=4 study(“Exponential Moving Average”, shorttitle=”EMA”, overlay=true) length = input(10, minval=1, title=”Length”) ema = ema(close, length) plot(ema, title=”EMA”, color=color.red)
Applications in Trend Analysis
- Identifying Trends: Both SMA and EMA can be used to identify the direction of the market trend. A rising moving average indicates an uptrend, while a falling moving average suggests a downtrend.
- Support and Resistance Levels: Moving averages often act as dynamic support or resistance levels. Prices tend to bounce off these levels before continuing their trend.
- Crossovers: One common strategy involves using two moving averages (e.g., 50-day SMA and 200-day SMA). When the shorter-term moving average crosses above the longer-term one (Golden Cross), it signals a potential uptrend. Conversely, when it crosses below (Death Cross), it may indicate a downtrend.
Incorporating moving averages into your trading strategy can provide valuable insights into market behavior. By understanding how different types of moving averages work and their applications in trend analysis, you can enhance your technical analysis toolkit with Pine Script indicators for stocks.
2. Oscillators in Pine Script
Relative Strength Index (RSI) is a widely used indicator for spotting overbought or oversold conditions in stocks. RSI is a momentum oscillator that measures the speed and change of price movements, providing traders with critical insights about market sentiment.
Key Features of RSI:
- Scale: The RSI scale ranges from 0 to 100.
- Overbought/Oversold Levels: Readings above 70 typically indicate that a stock may be overbought, while readings below 30 suggest it may be oversold.
- Trend Analysis: RSI can also help identify potential reversal points by signaling divergence between the price movement and the RSI value.
Applications in Trading:
- Overbought Conditions: When RSI exceeds 70, it suggests that a stock might be overvalued and due for a pullback.
- Oversold Conditions: An RSI reading below 30 indicates that a stock might be undervalued, potentially offering a buying opportunity.
- Divergence: A divergence occurs when the price moves in the opposite direction of the RSI. This can signal potential reversals, allowing traders to anticipate and act on changing trends.
Using Pine Script, you can easily incorporate RSI into your trading strategies. A basic script for RSI might look like this:
pinescript //@version=4 study(“RSI Example”, shorttitle=”RSI”, overlay=false) length = input(14, minval=1, title=”Length”) src = input(close, title=”Source”) rsi = rsi(src, length) plot(rsi, color=color.blue) hline(70, “Overbought”, color=color.red) hline(30, “Oversold”, color=color.green)
This script plots the RSI on your chart and highlights the overbought and oversold levels for quick reference. Using such oscillators in conjunction with other indicators like moving averages can enhance your ability to analyze stock trends effectively.
3. Advanced Trading Indicators with Pine Script
Pine Script enables the creation of sophisticated trading tools beyond basic moving averages and oscillators. These advanced indicators can provide deeper insights into market trends, with some acting as leading signals that help anticipate price movements and guide traders’ decisions.
Dynamic Trend Visualization Techniques
One powerful feature of Pine Script is its ability to create dynamic trend visualization tools. These tools adapt to market conditions in real-time, offering a visual representation of trend direction and strength. For instance, combining moving averages with volatility measures can highlight periods of consolidation versus trending phases.
Advanced Oscillators Beyond RSI
While the Relative Strength Index (RSI) is a popular choice for identifying overbought or oversold conditions, Pine Script allows for the development of more complex oscillators. Examples include:
- Stochastic Oscillator, which compares a particular closing price to a range of its prices over a certain period.
- MACD (Moving Average Convergence Divergence), which combines moving averages to detect changes in the strength, direction, momentum, and duration of a trend.
- Commodity Channel Index (CCI), used to identify cyclical trends in stock prices by measuring the current price level relative to an average price level over a given period.
By leveraging these advanced capabilities within Pine Script, you can create custom indicators that not only align with your trading strategy but also offer enhanced predictive power. The flexibility and depth that Pine Script provides make it an invaluable tool for any trader looking to gain an edge in the stock market.
Creating Custom Indicators with Pine Script: Step-by-Step Guide
Basic Indicator Example: Writing Your First Moving Average Script
Creating custom indicators with Pine Script offers endless possibilities for tailoring your technical analysis tools. Whether you’re a seasoned trader or just getting started, this step-by-step guide will help you write a simple moving average script in Pine Script.
Practical Demonstration of a Simple Moving Average Script
A moving average, one of the most commonly used indicators in technical analysis, helps smooth out price data to identify trends over specific periods. Pine Script makes it easy to code and customize your moving averages.
Step 1: Setting Up Your Pine Script Environment
To begin writing a script:
- Open TradingView.
- Navigate to the “Pine Editor” tab at the bottom of the screen.
- Click on “New” to start a new script.
This sets up your environment for coding the moving average indicator.
Step 2: Writing the Moving Average Code
A simple moving average can be coded with just a few lines. Here’s an example:
pinescript //@version=4 study(“Simple Moving Average”, shorttitle=”SMA”, overlay=true) length = input(14, minval=1, title=”Length”) src = input(close, title=”Source”) sma = sma(src, length) plot(sma, title=”SMA”, color=color.blue)
Breaking Down the Code:
- //@version=4: Specifies that we are using version 4 of Pine Script.
- study(“Simple Moving Average”, shorttitle=”SMA”, overlay=true): Defines the study (indicator) name, its short title, and specifies that it overlays on the price chart.
- length = input(14, minval=1, title=”Length”): Creates an input field for the length of the moving average with a default value of 14.
- src = input(close, title=”Source”): Allows choosing the data source for calculation; by default, it uses closing prices.
- sma = sma(src, length): Calculates the simple moving average based on the source and length inputs.
- plot(sma, title=”SMA”, color=color.blue): Plots the calculated SMA on the chart with a blue line.
For more detailed guidance on coding a simple moving average in Pine Script, refer to this comprehensive resource.
Step 3: Adding More Customization
You can add more customization to enhance functionality:
pinescript //@version=4 study(“Customizable Moving Average”, shorttitle=”CMA”, overlay=true) length = input(20, minval=1, title=”Length”) src = input(close, title=”Source”) line_color = input(color.green, title=”Line Color”) line_width = input(2, minval=1, maxval=5, title=”Line Width”) sma = sma(src, length) plot(sma, title=”CMA”, color=line_color, linewidth=line_width)
Additional Components:
- line_color = input(color.green, title=”Line Color”): Adds an option to change the line color.
- `line_width = input(2, minval=
Advanced Indicator Features: Implementing Complex Conditions and Risk Management Tools
Pine Script allows you to implement complex conditions in your custom indicators, enhancing their functionality to meet specific trading needs. For instance, you can create logic that triggers when specific criteria are met, such as moving average crossovers or RSI thresholds. Additionally, using the security function is essential for efficient data retrieval and avoiding redundant calculations, especially during indicator debugging and development.
Multiple Conditions Logic
Moving Average Crossovers
These occur when a short-term moving average crosses above or below a long-term moving average, signaling potential buy or sell opportunities.
pine // Define the short and long-term moving averages short_ma = ta.sma(close, 50) long_ma = ta.sma(close, 200)
// Create crossover conditions buy_signal = ta.crossover(short_ma, long_ma) sell_signal = ta.crossunder(short_ma, long_ma)
// Plot signals on the chart plotshape(series=buy_signal, location=location.belowbar, color=color.green, style=shape.labelup, text=”Buy”) plotshape(series=sell_signal, location=location.abovebar, color=color.red, style=shape.labeldown, text=”Sell”)
RSI Thresholds
The Relative Strength Index (RSI) can indicate overbought or oversold conditions. You can set thresholds to trigger alerts.
pine // Calculate RSI rsi = ta.rsi(close, 14)
// Define overbought and oversold levels overbought = rsi > 70 oversold = rsi < 30
// Plot signals on the chart plotshape(series=overbought, location=location.abovebar, color=color.red, style=shape.triangledown, text=”Overbought”) plotshape(series=oversold, location=location.belowbar, color=color.green, style=shape.triangleup, text=”Oversold”)
Incorporating Stop Loss and Take Profit Mechanisms
Risk management is crucial for successful trading. Pine Script simplifies integrating stop loss and take profit mechanisms into your scripts. Effective risk management strategies can significantly enhance your trading performance by minimizing potential losses and securing profits.
Stop Loss and Take Profit Example:
pine // Define entry price var float entry_price = na
// Set entry condition (e.g., buy signal from MA crossover) if (buy_signal) entry_price := close
// Define stop loss and take profit levels stop_loss_level = entry_price * (1 – 0.02) // Stop loss at -2% take_profit_level = entry_price * (1 + 0.05) // Take profit at +5%
// Plot stop loss and take profit levels on the chart plot(stop_loss_level, title=”Stop Loss”, color=color.red) plot(take_profit_level, title=”Take Profit”, color=color.green)
// Exit conditions based on stop loss and take profit levels exit_condition = close <= stop_loss_level or close >= take_profit_level
if (exit_condition) entry_price := na label.new(bar_index[1], high[1], “Exit Trade”, color=color
Automated Alerts and Notifications
Setting Up Real-Time Alerts in Pine Script
Setting up real-time alerts in Pine Script is a powerful tool that enables traders to respond instantly to important market events. Pine Script offers built-in functions that allow you to create automated alerts based on your custom calculation logic, whether you’re tracking price levels, trend changes, or specific trading strategy signals. For instance, you can configure an alert to notify you when your custom indicator crosses a critical threshold, or when a particular price move occurs in the market. This capability is invaluable for traders who manage multiple strategies or monitor several markets at once, as it helps save time and ensures you never miss a key trading opportunity. By leveraging Pine Script’s alert system, you can automate your monitoring process, allowing you to focus on strategy development and execution rather than constantly watching the charts. Real-time alerts help you adjust your trading approach promptly, making Pine Script a go-to tool for traders seeking efficiency and precision in their trading routines.
Practical Use Cases for Automated Notifications
Automated notifications in Pine Script can significantly enhance your trading strategies by keeping you informed about critical market conditions without the need for constant manual monitoring. For example, you can set up alerts to trigger when a custom technical indicator signals a potential trade, such as a moving average crossover or a breakout above a resistance level. This allows you to stay focused on other tasks while still being ready to act when your trading criteria are met. Additionally, automated alerts can be configured to notify you of broader market conditions, such as increased volatility or the impact of economic news releases, enabling you to adjust your strategies in real time. By integrating these notifications into your trading workflow, you can respond more effectively to market changes, enhance your decision-making process, and potentially improve your overall trading performance. Pine Script’s automated alerts empower traders to stay ahead of the market, making it easier to implement and refine custom strategies and indicators for maximum effectiveness.
Debugging and Optimization
Common Pine Script Errors and How to Fix Them
Debugging is an essential part of developing robust trading strategies and custom indicators in Pine Script. Traders often encounter common errors, such as syntax mistakes, incorrect use of built-in functions, or logical flaws in calculation logic. For example, misapplying moving averages or setting improper parameters for indicators can lead to inaccurate signals and suboptimal trading tools. To address these issues, Pine Script provides helpful debugging tools, including a console for identifying syntax errors and a strategy tester for backtesting your strategies on historical data. Utilizing these resources allows you to validate your logic and optimize your scripts before deploying them in live trading environments.
Educational videos, tutorials, and community forums are also valuable resources for troubleshooting and learning best practices. By following a structured approach—such as systematically reviewing your code, testing with different parameters, and consulting available resources—you can efficiently identify and resolve errors. This process not only enhances the reliability of your custom indicators and strategies but also helps you develop a deeper understanding of Pine Script’s advanced techniques. Continuous learning and optimization are key to building effective trading tools that adapt to changing market conditions and deliver consistent results.
Resources for Learning and Mastering Pine Script
Learning Resources
Pine Script offers a wealth of educational material to help you get started and advance your skills. Some valuable guides and tutorials include:
- TradingView’s Official Documentation: This is the go-to resource for understanding the basics of Pine Script. The documentation covers everything from syntax to more complex features.
- Online Courses: Platforms like Udemy and Coursera offer comprehensive courses that take you from beginner to advanced levels, often with hands-on projects.
- YouTube Tutorials: Channels like “TradingView” and “Backtest Rookies” provide step-by-step videos that can be extremely helpful for visual learners.
Community Support
Engaging with a supportive community can significantly enhance your learning experience. Consider joining these communities:
- TradingView Community: With thousands of published scripts, this is a treasure trove of examples and ideas. You can also follow other traders and see the indicators they’ve developed.
- Reddit Forums: Subreddits like r/algotrading and r/TradingView are excellent places to ask questions, share your work, and get feedback.
- Discord Groups: Many trading communities have Discord servers where you can engage in real-time discussions about Pine Script.
Books and Articles
Reading books and articles can provide deeper insights:
- Books: Titles like “The Essentials of Trading” by John Forman often include sections on custom scripting.
- Blogs: Websites such as Medium host articles from experienced traders who share their tips and strategies for mastering Pine Script.
Practice Platforms
Hands-on practice is crucial for mastering Pine Script:
- TradingView Paper Trading: Use TradingView’s paper trading feature to test your scripts in a risk-free environment.
- Backtesting tools within TradingView: Utilize backtesting tools within TradingView to refine your strategies using historical data.
By leveraging these resources, you can effectively build, test, and optimize custom indicators tailored to your specific trading needs.
Conclusion
Using for stock trading can greatly improve your strategies with custom technical analysis tools. With Pine Script, you get:
- Ease of Use: Even if you’re not a programmer, you can create and use custom indicators.
- Testing: Analyze past market data to assess and improve your trading strategies.
- Adaptability: Create complex indicators designed specifically for your requirements.
Exploring custom scripting can transform how you approach the market. Dive into Pine Script to unlock a world of possibilities in trading indicators.
What is Pine Script and how is it used in stock trading?
Pine Script is a lightweight programming language designed specifically for building trading indicators on TradingView. It allows traders to create custom indicators that can enhance their trading strategies and provide more personalized technical analysis tools.
What are the advantages of using Pine Script for creating stock indicators?
Pine Script offers several benefits, including accessibility for non-programmers, which allows more traders to utilize custom indicators. Additionally, it enables backtesting of trading strategies using historical market data, helping traders refine their approaches before applying them in real-time.
What are some popular indicators created with Pine Script?
Popular indicators created with Pine Script include moving averages (both simple and exponential) used for trend analysis, as well as oscillators like the Relative Strength Index (RSI) and Moving Average Convergence Divergence (MACD), which help identify overbought or oversold conditions in stocks.
How can I create a basic indicator using Pine Script?
To create a basic indicator in Pine Script, you can start by writing a simple moving average script. This involves defining the moving average function and its parameters within the code. A practical demonstration can help explain each component involved in the scripting process.
What resources are available for learning Pine Script?
There are numerous online guides and tutorials available that cover both basic and advanced topics related to Pine Script. Additionally, joining supportive communities where you can seek help or share your work with fellow traders interested in scripting can greatly enhance your learning experience.
What advanced features does Pine Script offer for custom indicators?
Pine Script provides advanced features such as implementing complex conditions like moving average crossovers or RSI thresholds. It also allows incorporating risk management tools into scripts, such as stop loss and take profit mechanisms, enabling traders to better manage their trades.

