Introduction to TradingView
TradingView is a leading charting platform that has garnered significant attention from traders globally for its robust features and user-friendly interface. Designed for a diverse array of traders, from beginners to seasoned professionals, TradingView offers an extensive suite of tools that cater to various trading styles and strategies. One of the platform’s most appealing aspects is its ability to support multiple asset classes, including stocks, currencies, cryptocurrencies, and commodities, making it a versatile choice for anyone engaged in financial markets.
The intuitive interface of TradingView is often highlighted as one of its strongest features. Users can easily navigate through complex data, customize their charts, and employ technical indicators with minimal effort. This ease of use fosters an environment where traders can quickly analyze market conditions and make informed decisions. Moreover, TradingView’s social network capabilities allow traders to share ideas, strategies, and insights, facilitating collaborative learning and enhancing overall trading experiences.
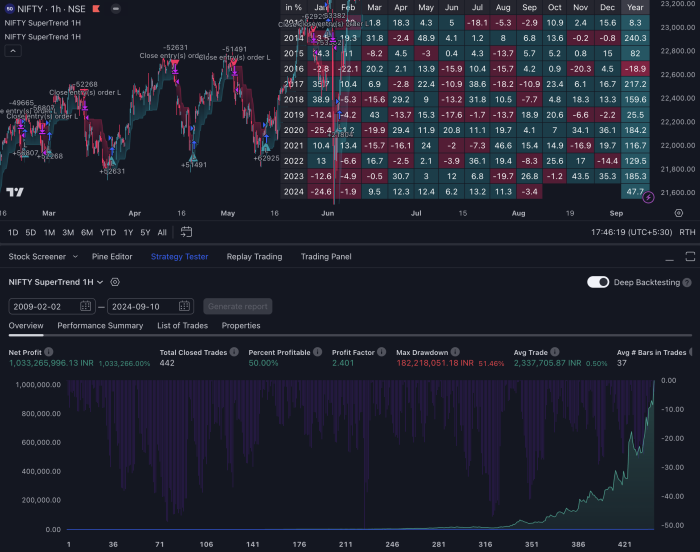
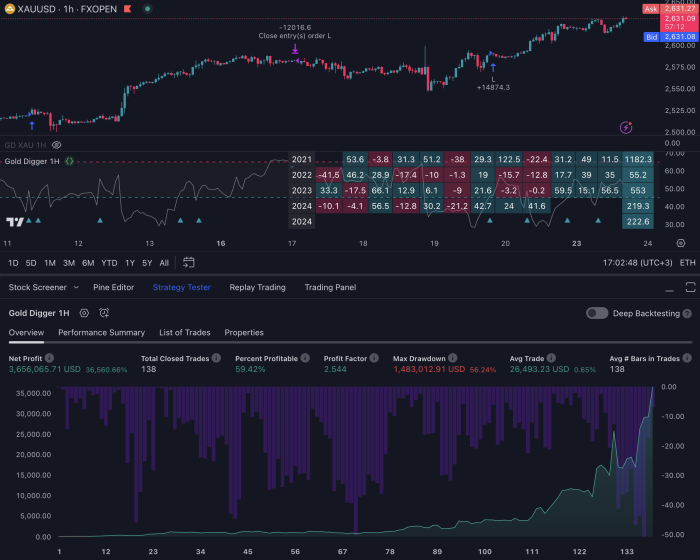
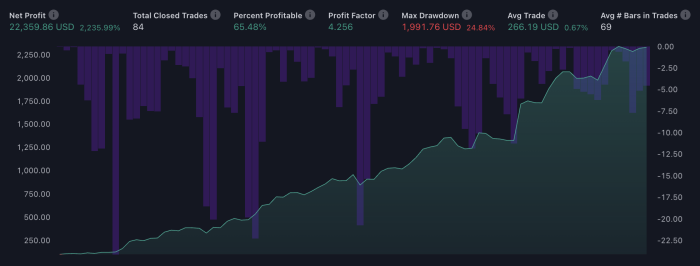
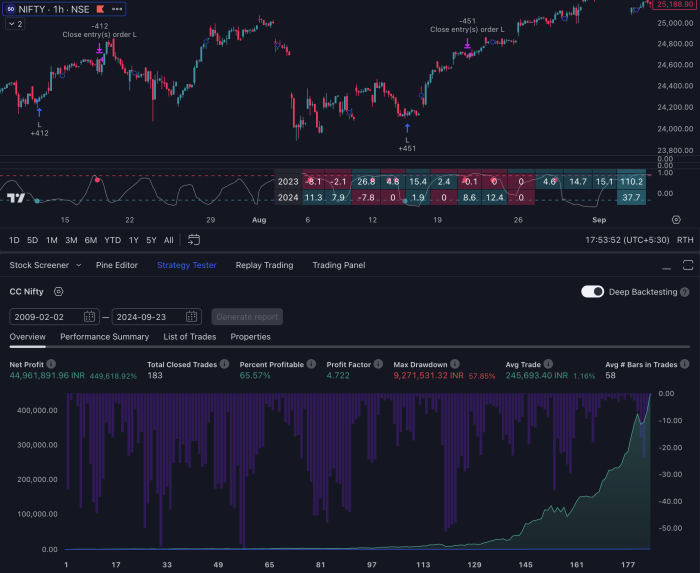
Given the platform’s comprehensive tools, it is essential for traders to develop effective trading strategies when using TradingView. The best TradingView strategies incorporate a blend of technical analysis, market research, and real-time data interpretation, enabling traders to identify potential trading opportunities and mitigate risks. Through the use of TradingView, traders can backtest their strategies using historical data, refine their approach, and enhance their decision-making processes. This empowers users to cultivate a deeper understanding of market behaviors, ultimately contributing to their trading success.
As TradingView continues to expand its features and community, the importance of integrating best trading strategies remains vital for traders looking to optimize their performance in the ever-evolving financial landscape.
Understanding the Basics of Trading Strategies
Trading strategies serve as essential frameworks for traders aiming to achieve successful outcomes in the markets. A trading strategy can be defined as a systematic approach that outlines the methodology followed for entering and exiting trades. The effectiveness of a trading strategy hinges on several key components, which include risk management, entry and exit points, and market analysis.
Risk management is arguably one of the most critical elements of effective trading. This component involves setting rules to minimize financial loss, ensuring that traders do not risk more than they can afford to lose. By implementing tight stop-loss orders and maintaining a balanced risk-to-reward ratio, traders can safeguard their capital. A well-structured approach to risk management can significantly increase the likelihood of long-term success, making it a fundamental aspect of the best TradingView strategies.
Another pivotal element is determining entry and exit points. An entry point is the price level at which a trader initiates a position, while the exit point is where they close that position. The decision-making process for these points should be based on a blend of technical indicators, such as moving averages, support and resistance levels, and candle pattern analysis. Utilizing these indicators effectively can optimize the timing of trades, which is essential for any viable trading strategy.
Finally, market analysis forms the backbone of any trading strategy. This can be divided into two main categories: technical analysis and fundamental analysis. Technical analysis involves examining past price movements and using statistical tools to predict future price behavior, while fundamental analysis examines economic indicators, company news, and market sentiment. By integrating both analysis types, traders can formulate robust strategies that can adapt to various market conditions, enhancing their chances of success with the best TradingView strategies.
Top Technical Analysis Strategies on TradingView
Technical analysis is a cornerstone of successful trading, and TradingView offers a robust platform to implement various strategies effectively. Among the most widely used techniques are moving averages, support and resistance levels, and candlestick patterns.
Moving averages serve as fundamental indicators to identify trends within financial markets. Two primary types utilized in TradingView are the Simple Moving Average (SMA) and the Exponential Moving Average (EMA). The SMA calculates the average price over a specified number of periods, providing a straightforward view of price trends. In contrast, the EMA gives more weight to recent prices, making it more responsive to market changes. In employing these moving averages, traders can determine potential entry and exit points, fostering a more strategic approach based on trend identification.
Support and resistance levels are pivotal in price action trading as they indicate potential reversal points in the market. Support levels signify price points where buying interest tends to outweigh selling pressure, while resistance levels indicate where selling interest typically exceeds buying pressure. Identifying these levels on TradingView can guide traders in setting stop-loss orders and take-profit levels, ultimately improving risk management strategies. These levels can be visualized using horizontal lines or zones drawn on the chart, facilitating better decision-making.
Candlestick patterns are another vital aspect of technical analysis, often revealing market sentiment and potential future price movement. Common patterns such as the Doji, Hammer, and Engulfing patterns can provide insights into market trends and reversals. Traders utilizing TradingView can observe these patterns in real-time, allowing for timely trading decisions. By mastering these technical analysis strategies, traders can enhance their trading performance using TradingView, ultimately leading to more informed trading actions.
Utilizing TradingView Indicators for Better Decisions
In the realm of trading, the effective use of indicators can significantly enhance decision-making processes. TradingView provides a variety of tools that traders can leverage, including the Relative Strength Index (RSI), Moving Average Convergence Divergence (MACD), and Bollinger Bands. Each of these indicators serves a unique purpose and can be integral to developing the best TradingView strategies.
The Relative Strength Index (RSI) is a momentum oscillator that measures the speed and change of price movements. It ranges from 0 to 100, with readings above 70 typically indicating that an asset is overbought, while readings below 30 suggest it may be oversold. Traders can utilize RSI to identify potential reversal points, thereby making informed decisions about when to enter or exit a trade. By incorporating the RSI into their strategies, traders can better gauge market momentum and avoid premature entries.
Moving Average Convergence Divergence (MACD) is another essential tool on TradingView that helps traders determine the strength of market trends. This indicator consists of two signal lines and a histogram, offering insights into market momentum and potential trend reversals. The MACD line crossing above the signal line may indicate a buying opportunity, whereas crossing below could signal an exit. By understanding the intricacies of MACD, traders can refine their best TradingView strategies to align with market movements more effectively.
Bollinger Bands are pivotal for assessing volatility and predicting price movements. This indicator consists of a moving average and two standard deviation lines above and below it. When the price approaches the upper band, it may indicate a market overbought scenario, while a move towards the lower band could signify oversold conditions. Traders can incorporate Bollinger Bands to enhance their strategies by focusing on potential breakouts or reversals, thus making more informed trading decisions.
Creating Custom Indicator Strategies
TradingView provides traders with an exceptional platform to analyze market trends and develop effective trading strategies. One of the standout features of TradingView is Pine Script, a powerful scripting language designed specifically for creating custom indicators and strategies. Understanding Pine Script is fundamental for traders looking to tailor their trading experience according to their specific needs.
Pine Script is relatively user-friendly, making it accessible for both novice and experienced traders. The syntax is similar to that of JavaScript, which simplifies the learning curve. Users can create indicators such as moving averages, oscillators, and more by writing succinct code snippets. The TradingView environment allows you to experiment with your scripts in real time, making adjustments and seeing how those changes affect your indicators immediately.
To build simple indicators using Pine Script, begin by defining the basic components, such as inputs for the indicator parameters and the logic that calculates the output. For instance, users can develop a moving average crossover strategy by calculating two moving averages—one short-term and another long-term—then visually representing these on the TradingView chart. An example of code to accomplish this might look like:
//@version=5indicator("Simple MA Crossover", overlay=true)shortMA = ta.sma(close, 14)longMA = ta.sma(close, 50)plot(shortMA, color=color.red)plot(longMA, color=color.blue)Moreover, backtesting is a crucial step in developing robust trading strategies. TradingView allows traders to test their custom indicators on historical data to evaluate their performance before applying them in real trading scenarios. This functionality helps ensure that the best TradingView strategies are grounded in data-driven insights, thus increasing their chances of success in live markets.
Combining Strategies for Comprehensive Market Analysis
In the realm of trading, employing a single strategy may not yield the desired results; thus, combining multiple strategies can lead to a more robust trading approach. One effective method for enhancing trading decisions is multi-timeframe analysis. This technique allows traders to observe price movements across various timeframes, providing a broader perspective on market trends. For instance, a trader might analyze long-term trends on a daily chart while using a shorter intraday chart to pinpoint optimal entry and exit points. Such a layered analysis can highlight inconsistencies and confirm signals, ultimately enabling traders to make more informed decisions regarding their trades.
Furthermore, integrating technical analysis with fundamental analysis can create a powerful combination that addresses the limitations inherent in using either approach in isolation. Technical analysis focuses on past market data, utilizing indicators and chart patterns to forecast future price movements. In contrast, fundamental analysis assesses external factors affecting security valuation, such as economic indicators, earnings reports, or geopolitical events. By bridging the gap between these analytical methods, traders can better understand the forces driving market changes and improve the accuracy of their predictions.
For example, if a trader observes a bullish chart pattern supported by favorable economic news, this confluence can create a higher probability trading setup. This strategy leverages the strengths of both methodologies, allowing traders to compare market sentiment through technical indicators alongside real-world developments reflected in fundamental data. Such comprehensive market analysis provides a well-rounded view, enhancing the likelihood of successful trades.
In conclusion, combining strategies like multi-timeframe analysis and the fusion of technical and fundamental analysis can significantly enhance trading effectiveness. By employing the best TradingView strategies tailored to individual trading preferences, traders can navigate the complexities of financial markets with greater confidence and precision.
Risk Management Techniques for Trading
Effective risk management is a cornerstone of successful trading, as it helps traders protect their capital and minimize losses. The significance of risk management cannot be overstated, as even seasoned traders can experience significant setbacks without a solid plan in place. By implementing robust risk management strategies, traders can enhance their decision-making process, ensuring they remain calm and collected even during volatile market conditions.
One critical aspect of risk management is position sizing. This refers to determining the appropriate size for each trade based on a trader’s overall risk tolerance and account balance. A general rule of thumb is to risk only a small percentage of the total capital on each trade, typically around one to two percent. By carefully calculating position size, traders can mitigate the impact of losing trades on their overall portfolio. Traders who utilize the best TradingView strategies typically incorporate position sizing into their methodologies, allowing them to manage risk effectively while pursuing profitable opportunities.
Another crucial element of risk management involves setting stop-loss and take-profit levels. A stop-loss order helps to limit potential losses by automatically closing a trade once it reaches a predetermined price level, while a take-profit order allows for the collection of gains once a target price is achieved. When implementing these strategies, it is important to position stop-loss and take-profit orders at logical levels based on market structure, technical indicators, or volatility measures. It is also beneficial to periodically reassess these levels as market conditions change to ensure they align with one’s trading strategy and current market dynamics. When employing the best TradingView strategies, having a disciplined approach to stop-loss and take-profit placement is fundamental to safeguarding profits and minimizing losses.
In conclusion, effective risk management techniques, including position sizing and the strategic placement of stop-loss and take-profit levels, play a vital role in a trader’s success. By prioritizing these aspects, traders can better navigate the complexities of the market while increasing their chances of achieving their trading objectives.
Case Studies: Successful TradingView Strategies in Action
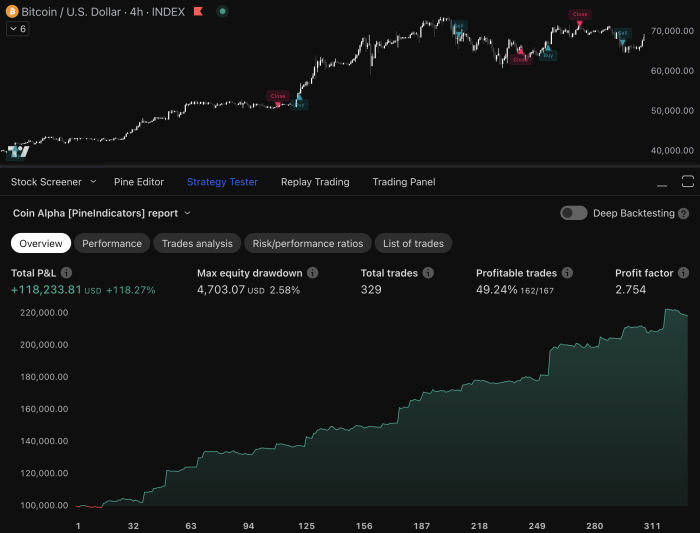
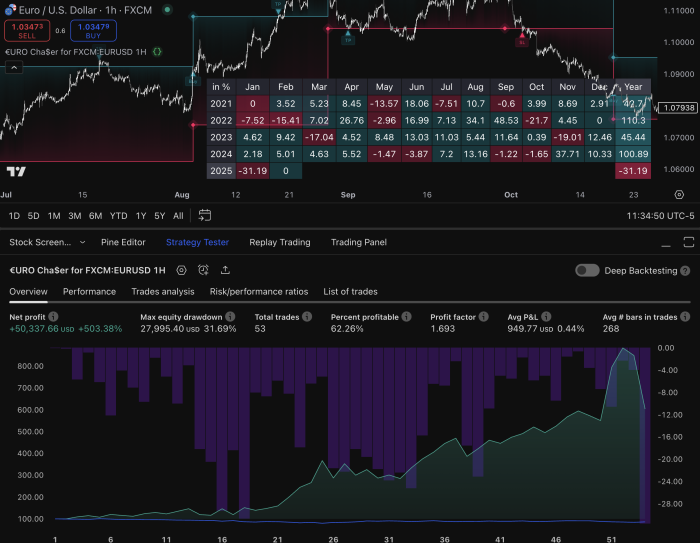
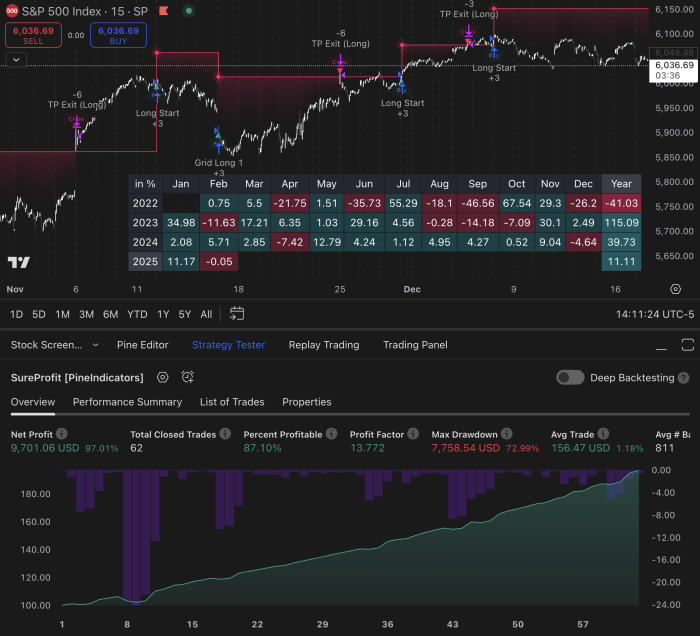
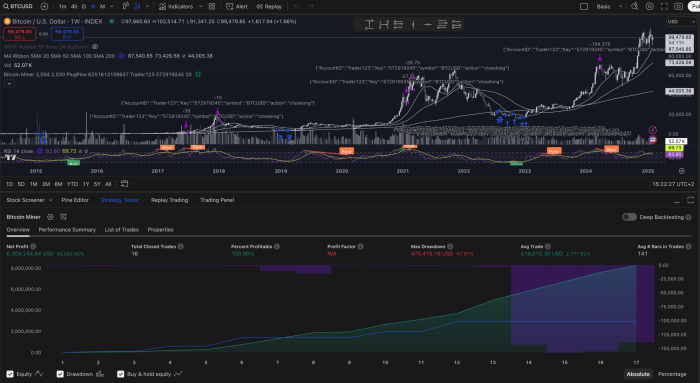
Examining real-world applications of TradingView strategies provides valuable insights into their effectiveness and adaptability in the field of trading. Notably, one exemplary case is a trader who successfully employed a combination of moving averages and the Relative Strength Index (RSI) within TradingView. This trader incorporated a simple moving average crossover strategy where a short-term moving average crossed above a long-term moving average, signaling potential bullish trends. Coupled with the RSI, which provided confirmation when the asset reached overbought or oversold territories, this strategy led to a high win rate in trades over several months.
Another successful application came from a day trader who utilized price action strategies on TradingView. By studying historical price charts and identifying key support and resistance levels, this trader executed buy and sell orders based on breakout patterns. The focus was on capturing small price movements effectively throughout the trading day, minimizing risk while maximizing potential profit. This case illustrates how effectively leveraging TradingView’s customizable indicators allowed the trader to refine their strategy and respond to market changes more dynamically.
From these examples, several lessons can be drawn for readers hoping to employ the best TradingView strategies in their own trading endeavors. First, combining multiple indicators can provide a more comprehensive trading signal, enhancing decision-making processes. Furthermore, traders should emphasize backtesting any strategy to validate its effectiveness under various market conditions. Lastly, it is crucial to adopt a disciplined approach to trading, understanding that even the best strategies will require continuous refinement and ample risk management.
Realizing the potential of TradingView tools can significantly impact a trader’s success, as demonstrated by these case studies. By analyzing and adapting proven methods, traders can develop a robust trading approach that aligns with their unique style and objectives.
Conclusion and Key Takeaways
In the realm of trading, having a solid strategy is crucial for success, and the importance of the best TradingView strategies cannot be overstated. Throughout this blog post, we have explored various approaches that traders can employ to enhance their market performance. Effective trading strategies help define a trader’s methodology, providing clarity and a structured plan to follow in the fast-paced trading environment.
One of the central themes covered is the significance of risk management. Understanding the potential risks associated with each trade and employing strategies to mitigate those risks is paramount. By integrating risk management principles into their trading routines, traders can safeguard their capital while maximizing potential returns. This dual focus on strategy and risk helps pave the way for more consistent trading results.
Another key point discussed is the array of unique tools available on TradingView. This platform offers various features that cater to traders of all experience levels, enabling users to leverage technical analysis, custom indicators, and collaborative trading insights to refine their strategies. The capability to backtest and simulate trades further fosters an environment conducive to learning and growth.
As we conclude, it is essential for traders to remain adaptable. The financial markets are dynamic, necessitating continuous learning and adjustment of strategies to align with evolving market conditions. By staying informed, experimenting with new techniques, and integrating the best TradingView strategies into their trading plan, individuals can improve their overall trading effectiveness. Embracing a mindset of ongoing education will undoubtedly contribute to long-term success in the trading arena.

