


In the realm of foreign exchange trading, the ability to make informed decisions is paramount. Forex indicators serve as essential tools that assist traders in analyzing market trends, identifying potential entry and exit points, and managing risk. These indicators are mathematical calculations based on price, volume, or open interest of a currency pair, and they can be categorized into two main types: leading and lagging indicators.
Leading indicators aim to predict future price movements, while lagging indicators provide insights based on past price data. Understanding how to effectively utilize these indicators can significantly enhance a trader’s ability to navigate the complexities of the forex market. The forex market operates 24 hours a day, making it one of the most dynamic and fast-paced trading environments.
As such, traders often rely on indicators to filter out noise and focus on actionable signals. With a plethora of indicators available, each with its unique methodology and application, it is crucial for traders to familiarize themselves with the most popular ones. This article delves into several key forex indicators, exploring their functions, advantages, and practical applications in trading strategies.
Key Takeaways
- Forex indicators are tools used by traders to analyze market trends and make informed trading decisions.
- Moving averages are used to smooth out price data and identify trends over a specific period of time.
- The Relative Strength Index (RSI) is a momentum oscillator that measures the speed and change of price movements.
- Bollinger Bands consist of a simple moving average and two standard deviations, which help traders identify overbought and oversold conditions.
- Fibonacci retracement levels are used to identify potential support and resistance levels based on the Fibonacci sequence.
- The stochastic oscillator is used to compare a security’s closing price to its price range over a specific period of time.
- MACD is a trend-following momentum indicator that shows the relationship between two moving averages of a security’s price.
- When using forex indicators, it’s important to combine multiple indicators for confirmation and to use them in conjunction with other forms of analysis for more accurate trading decisions.
Moving Averages
Moving averages are among the most widely used forex indicators due to their simplicity and effectiveness in smoothing out price data over a specified period. They help traders identify trends by filtering out short-term fluctuations and providing a clearer picture of the overall market direction. The two most common types of moving averages are the Simple Moving Average (SMA) and the Exponential Moving Average (EMA).
The SMA calculates the average price over a set number of periods, while the EMA gives more weight to recent prices, making it more responsive to new information. Traders often use moving averages in conjunction with other indicators to confirm trends or generate buy and sell signals. For instance, a common strategy involves using two moving averages of different lengths—such as a 50-period SMA and a 200-period SMWhen the shorter moving average crosses above the longer moving average, it generates a bullish signal, indicating that it may be time to enter a long position.
Conversely, when the shorter moving average crosses below the longer one, it signals a potential bearish trend, suggesting that traders should consider exiting their positions or entering short trades.
Relative Strength Index (RSI)

The Relative Strength Index (RSI) is a momentum oscillator that measures the speed and change of price movements. Developed by J. Welles Wilder Jr., the RSI ranges from 0 to 100 and is typically used to identify overbought or oversold conditions in a currency pair.
An RSI value above 70 indicates that an asset may be overbought, while a value below 30 suggests it may be oversold. This information can be invaluable for traders looking to capitalize on potential reversals. One of the key advantages of the RSI is its ability to provide early signals of potential trend reversals.
For example, if a currency pair is experiencing an uptrend but the RSI begins to decline from overbought territory, it may indicate that momentum is waning and a reversal could be imminent. Conversely, if a downtrend is accompanied by an RSI that starts to rise from oversold levels, it may suggest that buyers are beginning to enter the market. Traders often look for divergences between price action and the RSI as additional confirmation of potential reversals.
Bollinger Bands
| Period | Standard Deviation | Upper Band | Lower Band |
|---|---|---|---|
| 20 | 2.5 | 150.25 | 130.75 |
| 50 | 3.0 | 175.50 | 125.50 |
| 100 | 4.0 | 200.00 | 100.00 |
Bollinger Bands are another popular technical analysis tool that consists of three lines: a middle band (the SMA) and two outer bands that are standard deviations away from the middle band. This indicator provides insights into market volatility and potential price levels where reversals may occur. When the bands contract, it indicates low volatility and potential consolidation, while expansion suggests increased volatility and possible breakout opportunities.
Traders often use Bollinger Bands in conjunction with other indicators to enhance their trading strategies. For instance, when prices touch the lower band, it may signal an oversold condition, prompting traders to consider buying. Conversely, when prices reach the upper band, it may indicate an overbought condition, suggesting that traders should look for selling opportunities.
Additionally, Bollinger Bands can help identify trends; if prices consistently stay near one of the bands, it may indicate a strong trend in that direction.
Fibonacci Retracement
Fibonacci retracement levels are based on the Fibonacci sequence—a mathematical series where each number is the sum of the two preceding ones. In trading, these levels are used to identify potential support and resistance areas during price retracements. Traders typically plot horizontal lines at key Fibonacci levels—23.6%, 38.2%, 50%, 61.8%, and 100%—to gauge where price corrections might occur after a significant move.
The application of Fibonacci retracement levels can be particularly effective in trending markets. For example, after a strong upward movement in a currency pair, traders may look for price retracements to one of the Fibonacci levels before entering long positions again. Conversely, in a downtrend, traders might seek short opportunities at these retracement levels as potential resistance points.
The psychological aspect of Fibonacci levels also plays a role; many traders watch these levels closely, which can lead to self-fulfilling prophecies as market participants react to them.
Stochastic Oscillator
The Stochastic Oscillator is a momentum indicator that compares a currency pair’s closing price to its price range over a specific period. This indicator generates values between 0 and 100 and is typically used to identify overbought or oversold conditions.
One of the unique features of the Stochastic Oscillator is its ability to generate signals based on crossovers between its two lines: %K and %D. When the %K line crosses above the %D line in oversold territory, it can signal a potential buying opportunity. Conversely, when %K crosses below %D in overbought territory, it may indicate a selling opportunity.
Traders often combine this indicator with other tools to confirm signals and enhance their trading strategies.
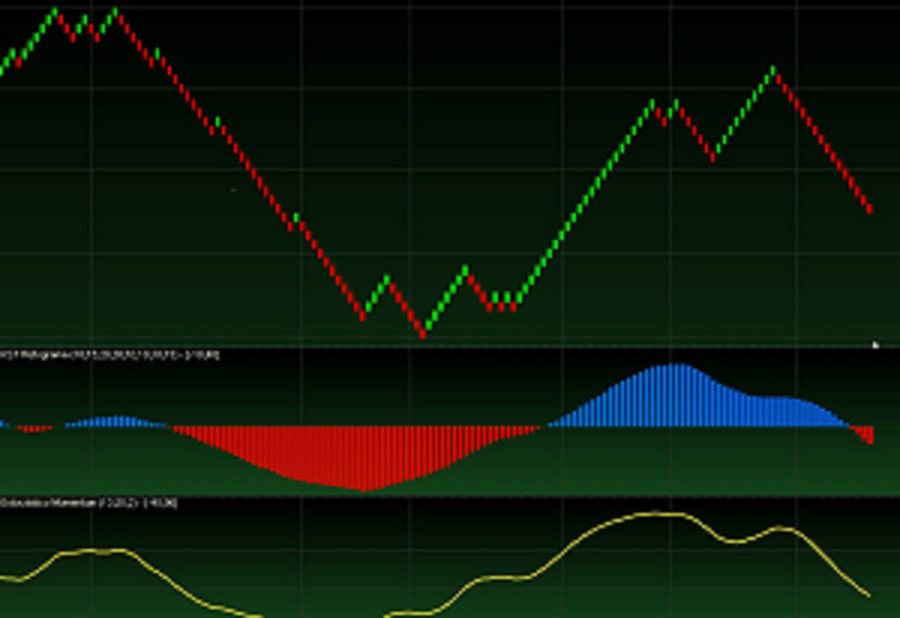
MACD (Moving Average Convergence Divergence)
The Moving Average Convergence Divergence (MACD) is a versatile indicator that combines elements of both trend-following and momentum strategies.
The MACD histogram represents the difference between these two lines and provides visual cues about momentum shifts.
Traders often look for crossovers between the MACD line and the signal line as potential buy or sell signals. A bullish signal occurs when the MACD line crosses above the signal line, indicating increasing upward momentum. Conversely, a bearish signal arises when the MACD line crosses below the signal line, suggesting downward momentum is gaining strength.
Additionally, divergence between MACD and price action can provide valuable insights; for instance, if prices are making new highs while MACD fails to do so, it may indicate weakening momentum and a potential reversal.
Conclusion and Tips for Using Forex Indicators
While forex indicators are powerful tools for enhancing trading strategies, they should not be used in isolation. Successful trading requires a comprehensive approach that includes risk management, market analysis, and an understanding of broader economic factors influencing currency movements. Traders should consider combining multiple indicators to confirm signals and reduce false positives.
Moreover, it’s essential for traders to develop their own trading plans based on their risk tolerance and trading style. Backtesting strategies using historical data can help traders understand how different indicators perform under various market conditions. Additionally, staying informed about economic news releases and geopolitical events can provide context for market movements that indicators alone may not capture.
Ultimately, mastering forex indicators involves practice and continuous learning. By experimenting with different combinations of indicators and refining their strategies over time, traders can enhance their decision-making processes and improve their overall performance in the forex market.
If you are looking to enhance your trading strategy with custom Pine Script indicators, you may want to consider hiring a Pine Script developer. Pine Indicators offers services to help traders create custom indicators tailored to their specific needs. By utilizing TradingView Pine Script algorithms, developers can create unique indicators that can provide valuable insights into market trends and potential trading opportunities. Hiring a Pine Script developer can give you a competitive edge in the forex market and help you make more informed trading decisions. Check out Pine Indicators’ article on the benefits of hiring a Pine Script developer here.
FAQs
What are forex indicators?
Forex indicators are tools used by traders to analyze the foreign exchange market and make informed trading decisions. They are used to identify trends, patterns, and potential entry and exit points for trades.
How do forex indicators work?
Forex indicators work by using mathematical calculations and historical price data to provide insights into market trends and potential future price movements. Traders use these indicators to gain a better understanding of market conditions and make more informed trading decisions.
What are the different types of forex indicators?
There are several types of forex indicators, including trend indicators, momentum indicators, volatility indicators, volume indicators, and support and resistance indicators. Each type of indicator provides different insights into market conditions and price movements.
Are forex indicators always accurate?
Forex indicators are not always accurate and should be used in conjunction with other forms of analysis and risk management strategies. While they can provide valuable insights, they are not foolproof and should be used with caution.
How can traders use forex indicators effectively?
Traders can use forex indicators effectively by understanding their strengths and limitations, using them in conjunction with other forms of analysis, and testing them in different market conditions. It’s also important for traders to have a solid understanding of the indicators they are using and how they can be applied to their trading strategy.
