Introduction
Pine Script is a programming language specifically created by TradingView for developing custom technical indicators and trading strategies. Traders from all over the world use Pine Script because it has the power to change how you trade on the TradingView platform.
Custom indicators and strategies can greatly enhance your trading experience and improve your chances of success. By tailoring these tools to your specific needs, you gain unique insights that standard indicators might miss.
Key takeaway: Using Pine Script for custom indicators and strategies allows you to:
- Backtest your strategies to ensure their viability before live trading.
- Automate trading decisions based on pre-defined criteria.
- Share and collaborate with other traders within the TradingView community.
Exploring Pine Script strategies such as Moving Average Crossover, Pullback Strategy, RSI-based approaches, Bollinger Bands, Mean Reversion, Volume-based methods, and ATR-based techniques can significantly elevate your trading game. This guide delves into these top Pine script strategies, providing detailed explanations and practical implementation tips.
Understanding Pine Script
1. Moving Average Crossover Strategy
The Moving Average Crossover Strategy is a staple in the world of technical analysis. It involves using two different moving averages to identify potential buy and sell signals in the market. This strategy capitalizes on the relationship between a short-term and a long-term moving average.
Explanation of Moving Average Crossover Strategy
- Short-term Moving Average (SMA): Captures recent price movements, providing quick insights into market trends.
- Long-term Moving Average (LMA): Smoother and less sensitive to short-term fluctuations, offering a broader view of market direction.
A buy signal is generated when the SMA crosses above the LMA, indicating upward momentum. Conversely, a sell signal occurs when the SMA crosses below the LMA, suggesting downward momentum.
Step-by-Step Guide to Implementing This Strategy in Pine Script
1. Initialize Your Script:
Start by defining your script with necessary inputs.
pinescript //@version=4 study(“Moving Average Crossover”, shorttitle=”MAC”, overlay=true)
2. Define Moving Averages:
Create variables for your short-term and long-term moving averages.
pinescript sma_length = input(9, title=”SMA Length”) lma_length = input(21, title=”LMA Length”)
sma = sma(close, sma_length) lma = sma(close, lma_length)
3. Plot Moving Averages:
Visualize your moving averages on the chart.
pinescript plot(sma, color=color.blue, title=”Short-Term MA”) plot(lma, color=color.red, title=”Long-Term MA”)
4. Generate Buy and Sell Signals:
Implement logic to detect crossovers between SMAs and LMAs.
pinescript buy_signal = crossover(sma, lma) sell_signal = crossunder(sma, lma)
plotshape(series=buy_signal, location=location.belowbar, color=color.green, style=shape.labelup, text=”BUY”) plotshape(series=sell_signal, location=location.abovebar, color=color.red, style=shape.labeldown, text=”SELL”)
5. Backtest Your Strategy:
Add code to simulate trades based on your signals.
pinescript strategy.entry(“Buy”, strategy.long, when=buy_signal) strategy.close(“Buy”, when=sell_signal)
Practical Tips for Optimization
- Adjust Timeframes: Test different SMA and LMA lengths to find optimal settings for various market conditions.
- Combine Indicators: Use additional technical indicators like RSI or MACD to filter false signals.
- Risk Management: Integrate stop-loss and take-profit levels to manage risk effectively.
By following these steps and tips, you can create a robust Moving Average Crossover Strategy in Pine Script that enhances your trading experience on the TradingView platform.
2. Pullback Strategy
The pullback strategy aims to capitalize on temporary price retracements within a prevailing trend. This approach assumes that prices, after moving in a particular direction, will temporarily reverse before resuming their original trend.
Techniques for Identifying Pullbacks:
- Fibonacci Retracement Levels: These levels indicate potential support or resistance areas where the price might reverse.
- Trendlines: Drawing trendlines helps in identifying the overall direction of the market and possible pullback points.
Coding the Pullback Strategy in Pine Script:
pinescript //@version=4 study(“Pullback Strategy”, shorttitle=”PS”, overlay=true)
// Define inputs len = input(14, title=”Length”) src = close
// Calculate moving average sma = sma(src, len) plot(sma, color=color.blue)
// Identify pullbacks pullback = crossover(src, sma) or crossunder(src, sma)
// Entry and Exit Signals buySignal = crossover(src, sma) sellSignal = crossunder(src, sma)
// Plot buy/sell signals plotshape(series=buySignal, location=location.belowbar, color=color.green, style=shape.labelup, text=”BUY”) plotshape(series=sellSignal, location=location.abovebar, color=color.red, style=shape.labeldown, text=”SELL”)
// Risk Management stopLossLevel = sma * 0.95 takeProfitLevel = sma * 1.05
plot(stopLossLevel, color=color.red) plot(takeProfitLevel, color=color.green)
Risk Management Tips:
- Stop-Loss Orders: Place them at key support levels to limit potential losses.
- Take-Profit Orders: Set them at resistance levels to lock in gains.
This script uses simple moving averages and basic conditions to identify pullbacks. Adjusting parameters like the length of the moving average can help optimize the strategy based on different market conditions.
3. Relative Strength Index (RSI) Strategy
Understanding the RSI
The Relative Strength Index (RSI) is a popular momentum oscillator used by traders to gauge overbought or oversold market conditions. By measuring the speed and change of price movements, RSI helps traders identify potential reversal points.
Implementing an RSI-Based Trading Strategy in Pine Script
To implement an RSI-based strategy in Pine Script:
- Define RSI Parameters: Adjust the indicator’s parameters based on different timeframes or asset classes.
- pinescript //@version=4 study(“RSI Strategy”, shorttitle=”RSI”, overlay=true) rsiLength = input(14, title=”RSI Length”) overbought = input(70, title=”Overbought Level”) oversold = input(30, title=”Oversold Level”) rsi = rsi(close, rsiLength)
- Generate Buy and Sell Signals: Create conditions for when to buy or sell based on RSI levels.
- pinescript buySignal = crossover(rsi, oversold) sellSignal = crossunder(rsi, overbought)
- plotshape(series=buySignal, location=location.belowbar, color=color.green, style=shape.labelup, text=”BUY”) plotshape(series=sellSignal, location=location.abovebar, color=color.red, style=shape.labeldown, text=”SELL”)
- Optimize and Test: Backtest your strategy to see how it performs under different market conditions.
Limitations and Considerations
While the RSI is a powerful tool:
- False Signals: During strong trends, the RSI can remain in overbought or oversold conditions for extended periods.
- Confirmation Needed: Combining RSI with other indicators or volume analysis can improve accuracy.
- Parameter Sensitivity: Different assets may require different RSI settings; always test before deploying live trades.
Using Pine Script on the TradingView platform allows you to customize and refine these strategies efficiently. The domain-specific programming language makes it easier to develop indicators tailored to your trading style.
4. Bollinger Bands Strategy
Bollinger Bands are a popular technical analysis tool used to measure price volatility around a moving average line. This strategy involves two standard deviation lines plotted above and below a simple moving average (SMA). The bands expand and contract based on market volatility, providing insights into overbought and oversold conditions.
Key Concepts:
- Bollinger Bands: Consist of an upper band, lower band, and middle SMA.
- Overbought Signals: When prices touch or exceed the upper band.
- Oversold Signals: When prices touch or fall below the lower band.
Trading Opportunities:
- Going Long: Entering a long position when prices touch the lower band during a downtrend, anticipating a reversal.
- Shorting: Entering a short position when prices reach the upper band during an uptrend, expecting a downturn.
Coding Bollinger Bands in Pine Script:
Pine Script is a programming language designed for traders on the TradingView platform. It has user-friendly syntax and extensive community support for creating custom indicators and strategies.
pinescript //@version=4 study(“Bollinger Bands Strategy”, overlay=true) length = input(20, title=”SMA Length”) src = close mult = input(2.0, title=”Standard Deviation Multiplier”)
basis = sma(src, length) dev = mult * stdev(src, length) upper = basis + dev lower = basis – dev
plot(basis, color=color.blue) p1 = plot(upper, color=color.red) p2 = plot(lower, color=color.green) fill(p1, p2, color=color.purple, transp=90)
// Example signals longCondition = crossover(src, lower) shortCondition = crossunder(src, upper)
plotshape(series=longCondition, location=location.belowbar, color=color.green, style=shape.labelup, text=”BUY”) plotshape(series=shortCondition, location=location.abovebar, color=color.red, style=shape.labeldown, text=”SELL”)
Adding additional filters like volume confirmation or trend strength indicators can enhance accuracy. For instance:
- Volume Confirmation: Use volume spikes to validate entry signals.
- Trend Strength Indicators: Combine with RSI or MACD to confirm trend direction before executing trades.
This approach leverages the strengths of Pine Script to create effective trading strategies using Bollinger Bands.
5. Mean Reversion Strategy
The mean reversion concept in trading suggests that prices tend to revert back towards their historical average over time. This strategy takes advantage of deviations from the average, betting that prices will return to their mean.
Commonly used indicators for mean reversion strategies include the Moving Average Convergence Divergence (MACD) and the Stochastic Oscillator. These indicators help identify overbought or oversold conditions, ideal for executing mean reversion trades.
To implement a mean reversion strategy in Pine Script, you can use built-in functions to calculate these indicators and set up your trading rules. Here’s an example using the Pine Script language:
pinescript //@version=5 indicator(“Mean Reversion Example”, overlay=true)
// Define MACD parameters fast_length = 12 slow_length = 26 signal_smoothing = 9
// Calculate MACD [macdLine, signalLine, _] = ta.macd(close, fast_length, slow_length, signal_smoothing)
// Define Stochastic Oscillator parameters kLength = 14 dSmoothing = 3
// Calculate Stochastic Oscillator k = ta.stoch(close, high, low, kLength) d = ta.sma(k, dSmoothing)
// Trading signals buySignal = (macdLine < signalLine) and (k < 20) sellSignal = (macdLine > signalLine) and (k > 80)
// Plot buy and sell signals on the chart plotshape(series=buySignal, location=location.belowbar, color=color.green, style=shape.labelup, text=”BUY”) plotshape(series=sellSignal, location=location.abovebar, color=color.red, style=shape.labeldown, text=”SELL”)
It’s crucial to set realistic profit targets based on recent price swings. This ensures you capture potential gains while managing risk effectively. Pine Script’s user-friendly syntax and extensive community support make it a powerful tool for creating such custom strategies on the TradingView platform.
6. Volume-based Strategies
Trading volume analysis is a powerful tool that can provide valuable insights into market strength and potential reversals. By incorporating this analysis into your decision-making process, you can gain a deeper understanding of the market dynamics and make more informed trading decisions.
Types of Volume-based Strategies:
1. Volume Weighted Average Price (VWAP) Breakout Trades
VWAP represents the average price a security has traded at throughout the day, based on both volume and price. Traders use VWAP to identify potential breakout points.
For instance:
- When the price crosses above VWAP, you might consider it a buy signal.
- Crossing below could be a sell signal.
2. On-Balance Volume (OBV) Divergence Plays
OBV measures cumulative buying and selling pressure by adding volume on up days and subtracting it on down days. Divergences between OBV and price can indicate potential trend reversals.
For example:
- If prices are rising but OBV is falling, this could suggest a weakening uptrend.
Implementing these strategies in Pine Script, the domain-specific programming language designed for traders on the TradingView platform, is straightforward due to its user-friendly syntax and extensive community support. Below is a simple example of coding a VWAP strategy:
pinescript //@version=4 study(“VWAP Strategy”, shorttitle=”VWAP”, overlay=true)
vwap = vwap(close) plot(vwap, color=color.blue)
longCondition = crossover(close, vwap) shortCondition = crossunder(close, vwap)
plotshape(series=longCondition, location=location.belowbar, color=color.green, style=shape.labelup, text=”BUY”) plotshape(series=shortCondition, location=location.abovebar, color=color.red, style=shape.labeldown, text=”SELL”)
Using Pine Script allows you to backtest these strategies directly on TradingView, ensuring they align with your trading objectives before deploying them in live markets. This approach combines technical analysis with practical risk management to enhance your trading performance.
7. ATR-based Strategies
The Average True Range (ATR) is a widely-used volatility measure that helps traders determine optimal stop-loss levels and position sizing rules based on current market conditions. Developed by J. Welles Wilder, ATR tracks the degree of price volatility over a specified period, making it an essential tool for risk management.
Key Features of ATR in Trading:
- Volatility Measurement: ATR provides a quantitative value representing the volatility of an asset, helping you gauge how much an asset’s price typically moves within a given timeframe.
- Dynamic Stop-Loss Levels: By using ATR values, you can set stop-loss levels that adjust to market volatility, ensuring your stop-loss orders are neither too tight nor too loose.
- Position Sizing: ATR helps you determine the size of your positions based on current market volatility, allowing you to manage risks more effectively.
Implementing ATR in Pine Script:
You can calculate real-time ATR values through Pine Script and use them to make dynamic adjustments to your trading strategy. Here’s a basic example:
pine //@version=4 study(“ATR-based Stop Loss”, shorttitle=”ATR SL”, overlay=true) length = input(14, minval=1) atrValue = atr(length) stopLossMultiplier = input(1.5, title=”Stop Loss Multiplier”)
longStopLoss = close – (atrValue * stopLossMultiplier) shortStopLoss = close + (atrValue * stopLossMultiplier)
plot(longStopLoss, color=color.red, title=”Long Stop Loss”) plot(shortStopLoss, color=color.green, title=”Short Stop Loss”)
This script calculates the 14-period ATR and multiplies it by a user-defined factor to set dynamic stop-loss levels. The calculated stop-loss values are plotted on the chart for easy visualization.
Using ATR in this way allows you to adapt your entry and exit points according to real-time market conditions. This flexibility can significantly enhance your trading strategy’s robustness and effectiveness.
Backtesting Strategies with Pine Script
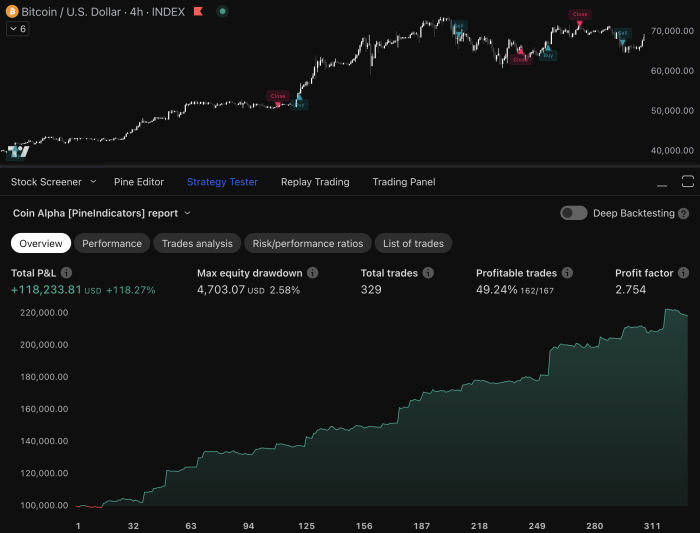
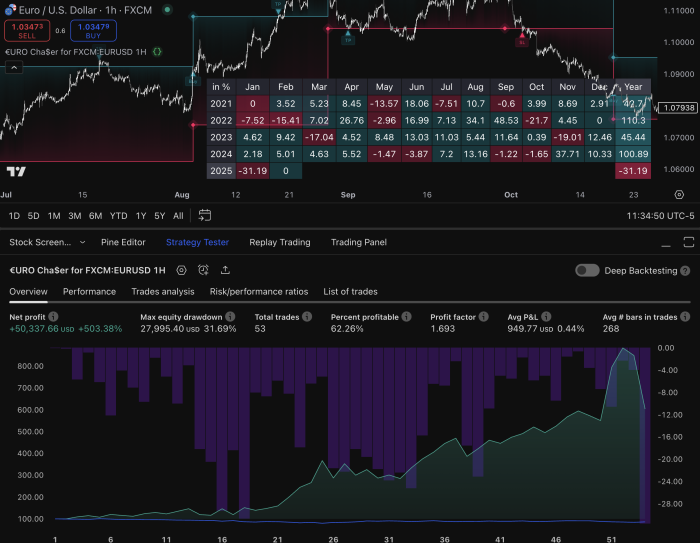
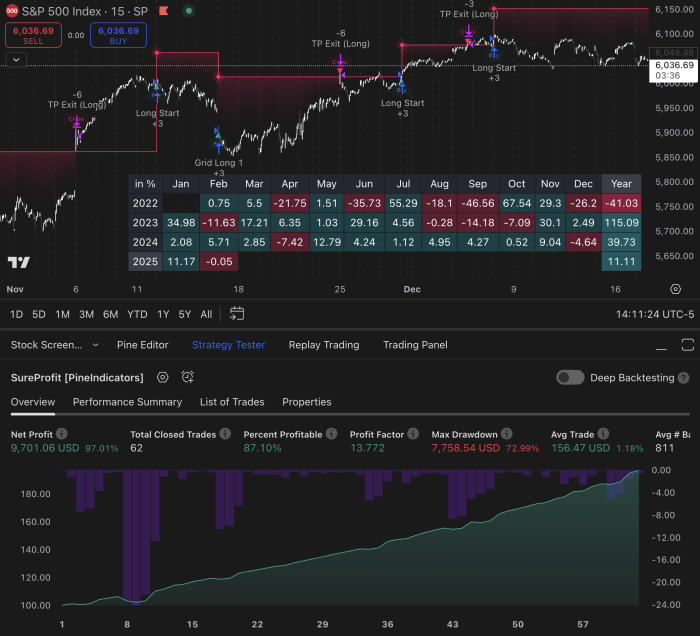
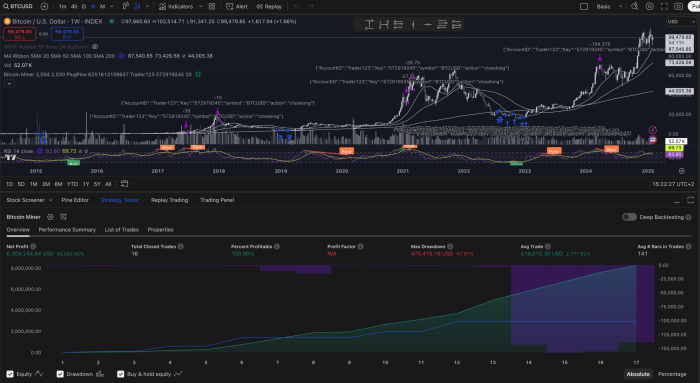
Backtesting is an essential step before using any trading strategy in real-time. It lets you evaluate how your strategies would have performed in the past under various market conditions without risking actual money. This process can uncover the strengths and weaknesses of your approach, helping you fine-tune and improve your trading methods.
Why Backtest?
- Evaluate Historical Performance: Understand how your strategy would have performed in past market conditions.
- Identify Weaknesses: Spot potential pitfalls and areas for improvement.
- Risk Management: Develop better risk management strategies by observing historical drawdowns and volatility.
Step-by-Step Guide to Backtesting in Pine Script
1. Set Up Your Script:
Start by defining your strategy’s parameters and rules. Use the strategy() function to initialize the backtest environment.
pine //@version=5 strategy(“My Strategy”, overlay=true)
2. Define Buy/Sell Conditions:
Establish the conditions under which your strategy will enter or exit trades. For example, a Moving Average Crossover strategy might look like this:
pine shortMA = ta.sma(close, 10) longMA = ta.sma(close, 50)
if (ta.crossover(shortMA, longMA)) strategy.entry(“Buy”, strategy.long)
if (ta.crossunder(shortMA, longMA)) strategy.close(“Buy”)
3. Add Performance Metrics:
Utilize built-in functions such as strategy.equity and strategy.performance to track key performance indicators.
4. Run the Backtest:
Execute the script on different historical data sets to observe how it performs.
5. Interpret Results:
- Profit Factor: Ratio of gross profit to gross loss.
- Max Drawdown: Largest peak-to-valley decline.
- Win Rate: Percentage of profitable trades.
Best Practices
- Diverse Data Sets: Test across various timeframes and market conditions to ensure robustness.
- Parameter Tuning: Adjust your input parameters to find the optimal settings for different assets or market phases.
- Avoid Overfitting: Ensure that your strategy isn’t overly optimized for historical data at the expense of future performance.
By thoroughly backtesting your strategies using Pine Script’s powerful features, you can greatly improve your trading performance and confidence in implementing strategies live.
Community Collaboration on TradingView
The lively TradingView community offers many advantages when it comes to sharing scripts, getting feedback from other traders, or even finding inspiration for new ideas. This platform creates an environment where knowledge is shared openly, allowing traders to learn from each other’s experiences and insights.
Sharing Scripts:
- By sharing your scripts with the community, you can receive valuable feedback that can help you refine and optimize your strategies.
- You also contribute to the collective learning of the community, helping others improve their trading skills.
Seeking Feedback:
- Posting your scripts on public forums or in dedicated TradingView groups can attract constructive criticism and suggestions from experienced traders.
- Engaging in discussions about your strategy’s performance or potential improvements can lead to more robust and effective trading tools.
Finding Inspiration:
- Browsing through the scripts shared by other traders can spark new ideas for your own strategies.
- You might discover innovative approaches or modifications that can be incorporated into your existing methodologies.
Tips for Leveraging the Collaborative Environment
- Proper Attribution:When using someone else’s script as a foundation for your own work, ensure you give proper credit to the original author.
- Include comments in your code indicating where the original idea came from and how you’ve modified it.
- Engagement:Actively participate in community discussions by commenting on others’ scripts and providing feedback.
- This not only helps others but also establishes you as a knowledgeable and helpful member of the community.
- Continuous Learning:Stay updated with the latest trends and techniques being discussed within the community.
- Regularly review top-rated scripts and analyses to keep improving your own trading strategies.
By leveraging the collaborative environment of TradingView, you can enhance your Pine Script skills while contributing positively to the trading community.
Conclusion
Exploring top Pine script strategies can significantly elevate your trading game on the TradingView platform. Whether you choose a Moving Average Crossover to identify trends, a Pullback Strategy for retracement opportunities, or an RSI-based strategy to navigate market momentum, Pine Script offers versatile tools to bring these strategies to life.
You might find the Bollinger Bands strategy useful for identifying volatility extremes, or perhaps the Mean Reversion approach aligns with your belief in price normalization. Volume and ATR-based strategies offer additional layers of analysis to enhance your decision-making process.
Using these strategies with Pine Script not only allows for customizations tailored to your trading style but also provides the ability to backtest and optimize for better performance. Embrace the power of Pine Script, and unlock new potentials in your trading journey.
FAQs (Frequently Asked Questions)
What is Pine Script and why is it significant in TradingView?
Pine Script is a domain-specific programming language designed for traders, enabling them to create custom indicators and strategies on the TradingView platform. Its significance lies in its user-friendly syntax and extensive community support, which greatly enhance the trading experience and improve the chances of success.
How does the Moving Average Crossover Strategy work?
The Moving Average Crossover Strategy involves using two different moving averages to identify potential buy and sell signals in the market. By observing when a shorter-term moving average crosses above or below a longer-term moving average, traders can make informed decisions on entering or exiting trades.
What is the Pullback Strategy in trading?
The Pullback Strategy aims to capitalize on temporary price retracements within a prevailing trend. Traders use technical analysis tools like Fibonacci retracement levels or trendlines to identify pullbacks and determine entry points, while also implementing risk management techniques such as setting stop-loss orders at key support/resistance levels.
How can I implement an RSI-based trading strategy using Pine Script?
To implement an RSI-based trading strategy in Pine Script, traders can gauge overbought or oversold market conditions using the Relative Strength Index (RSI). Adjusting the indicator’s parameters based on different timeframes or asset classes can optimize performance, but it’s important to consider limitations when relying solely on RSI signals for trade execution.
What are Bollinger Bands and how do they work in trading strategies?
Bollinger Bands measure price volatility around a moving average line. Traders can identify potential trading opportunities by going long when prices touch the lower band during a downtrend or shorting when they reach the upper band during an uptrend. Coding Bollinger Bands in Pine Script can be enhanced with additional filters like volume confirmation for better accuracy.
Why is backtesting important before deploying a trading strategy?
Backtesting is crucial as it allows traders to assess the historical performance of their strategies across different market environments without risking real capital. Using built-in functions available in Pine Script, traders can effectively backtest their strategies and interpret results accurately to make informed decisions.

