Introduction
TradingView is a popular trading platform known for its wide range of tools designed for traders in various financial markets. Whether you’re new to trading or have years of experience, TradingView has resources to help you understand and navigate the complexities of the market.
Effective trading strategies are crucial in the financial markets. They provide a structured approach to decision-making, helping you manage risks and capitalize on market opportunities. Without a clear strategy, trading can become akin to gambling, often leading to inconsistent results and potential losses.
In this article, we’ll explore the different types of trading strategies available on TradingView:
- Technical Indicators-Based Strategies: Utilizing moving averages and candlestick patterns.
- Notable Trading Strategies: Exploring specific examples like the N Bar Reversal Detector, Opening Range Breakout, Machine Learning Adaptive SuperTrend, and Smart Money Concepts.
- Creating Custom Strategies: Using Pine Script to tailor strategies to your unique needs.
- Backtesting Strategies: Validating the performance of your strategies with historical data.
- Community Resources: Leveraging user-generated scripts and engaging with TradingView’s vibrant community.
By understanding and implementing these strategies, you can enhance your trading success on TradingView.
Understanding Trading Strategies
Trading strategies are systematic plans that define how you will enter and exit trades in the financial markets. These strategies combine various forms of market analysis and aim to provide a structured approach to trading, reducing emotional decision-making.
Having a clear trading plan is crucial. It guides your actions and helps maintain discipline during market fluctuations. This plan should include:
- Entry and Exit Criteria: Specific conditions under which you will buy or sell.
- Risk Management: Rules to limit losses, such as stop-loss orders.
- Position Sizing: Guidelines on the amount of capital allocated to each trade.
Different traders have varying objectives, which influence their choice of strategies. Some focus on short-term trading, looking to capitalize on daily price movements. Others prefer long-term trading, aiming for substantial gains over months or years.
Understanding these elements helps you develop a strategy aligned with your trading goals, whether they are short-term profits or long-term investments.
Types of Trading Strategies on TradingView
1. Technical Indicators-Based Strategies
Technical indicators are mathematical calculations based on historical price, volume, or open interest data. These indicators help traders predict future price movements and identify trading opportunities. On TradingView, you have access to a wide array of technical indicators that form the foundation of many trading strategies.
Explanation of Technical Indicators:
- Moving Averages: One of the most widely used indicators, moving averages smooth out price data to identify trends over a specific time period. The Simple Moving Average (SMA) and Exponential Moving Average (EMA) are common types.
- Example: A trader might use the 50-day SMA to determine the overall direction of a stock’s trend. When the stock price crosses above this average, it may signal a buying opportunity; conversely, crossing below could indicate a sell signal.
- Candlestick Patterns: These patterns represent price movements within a specific timeframe and provide visual cues about market sentiment.
- Example: The Doji is a candlestick pattern that signifies indecision among traders. When combined with other signals, it can indicate potential reversals.
Popular Technical Indicators on TradingView:
- Relative Strength Index (RSI): This momentum oscillator measures the speed and change of price movements. RSI values range from 0 to 100, with readings above 70 indicating overbought conditions and below 30 indicating oversold conditions.
- Bollinger Bands: Developed by John Bollinger, these bands consist of a middle SMA band with an upper and lower band based on standard deviation. They help identify volatility and potential price breakouts.
- MACD (Moving Average Convergence Divergence): This indicator shows the relationship between two moving averages and helps traders identify bullish or bearish momentum.
Trading strategies using technical indicators can be simple or complex depending on how many indicators are combined and what rules are applied for trade entry and exit. For instance:
- Simple Strategy Example: Use the EMA crossover strategy where you buy when a short-term EMA crosses above a long-term EMA and sell when it crosses below.
- Complex Strategy Example: Combine RSI, Bollinger Bands, and MACD to create a multi-faceted approach that filters out false signals.
TradingView makes it easy to apply these strategies directly onto your charts by selecting indicators from its extensive library. By customizing settings and combining different indicators, you can develop unique strategies tailored to your trading style. You might also want to explore different types of technical analysis that can further enhance your trading strategies.
2. Notable Trading Strategies Available on TradingView
TradingView offers a wide variety of trading strategies to suit different trading styles and goals. These strategies use various technical indicators, market patterns, and advanced analysis methods. Here are some noteworthy complete trading strategies you can discover on TradingView:
- N Bar Reversal Detector: Spots reversal patterns based on a series of candles and uses trend indicators to filter signals.
- Opening Range Breakout: Identifies breakouts from the price range set during the first period of a trading session.
- Machine Learning Adaptive SuperTrend: Applies machine learning techniques to adjust to market volatility for improved trading decisions.
- Smart Money Concepts: Concentrates on the actions of institutional investors, offering insights into market structure and liquidity levels.
These strategies provide traders with strong frameworks for making well-informed trading choices, each designed for specific market conditions and trading objectives.
N Bar Reversal Detector Strategy
The N Bar Reversal Detector strategy is a powerful tool designed to find potential turning points in the market. This strategy relies on spotting specific patterns within a series of candles, which indicate a change in market direction. By using these reversal patterns, traders can make better decisions about when to enter or exit trades.
Key features of the N Bar Reversal Detector strategy include:
- Pattern Recognition: The core of this strategy is its ability to recognize specific reversal patterns within ‘N’ bars or candlesticks. These patterns indicate that the current trend is likely coming to an end and a new trend may be starting.
- Trend Indicators: To enhance the reliability of the signals, this strategy often incorporates various trend indicators. These indicators help filter out false signals and confirm the validity of detected reversal patterns.
- Customization: On TradingView, you can customize the parameters of this strategy to suit your trading style and risk tolerance. This flexibility allows you to adjust the number of bars (‘N’) and other relevant settings.
Advantages of using reversal patterns for decision-making in trading:
- Early Entry Points: Identifying reversals early allows you to enter trades at the beginning of new trends, potentially maximizing profit opportunities.
- Risk Management: By recognizing when a trend is reversing, you can avoid entering or staying in trades that are losing momentum, thus managing risk effectively.
- Enhanced Accuracy: Combining reversal patterns with trend indicators increases the accuracy of your trading decisions. It reduces the likelihood of acting on false signals that could lead to losses.
Using the N Bar Reversal Detector strategy on TradingView can help you find market reversals more systematically, improving both your entry timing and overall trade management.
Opening Range Breakout Strategy
The Opening Range Breakout strategy is a popular method among day traders. This strategy revolves around the concept of breakout trading, specifically focusing on the price range established during the initial minutes of a trading session. Here’s how it works:
- Identify the Opening Range: The first step involves defining a specific time frame at the beginning of the trading session—commonly 15, 30, or 60 minutes—during which you observe the highest and lowest prices.
- Set Breakout Levels: Once the opening range is determined, you set breakout levels at both the high and low points of this range.
- Trigger Trades: A trade is triggered when the price breaks above or below these predefined levels. For instance, if the price breaks above the high of the opening range, it signals a potential upward trend, prompting a buy order. Conversely, a break below the low suggests a downward trend, triggering a sell order.
The main components of this strategy are straightforward:
- Time Frame Selection: Choose an appropriate time frame to establish the opening range.
- Breakout Levels: Clearly define high and low points within this range.
- Trade Execution: Execute trades based on whether the price breaks above or below these levels.
Ideal market conditions for applying this strategy include periods with notable volatility and volume, typically around major market openings or significant economic announcements. These conditions increase the likelihood of substantial price movements beyond the initial range, making breakout strategies more effective.
Incorporating technical indicators like moving averages or volume indicators can further enhance this strategy by providing additional confirmation for potential breakouts. Understanding these components and ideal conditions will help you effectively implement the Opening Range Breakout strategy on TradingView.
Machine Learning Adaptive SuperTrend Strategy
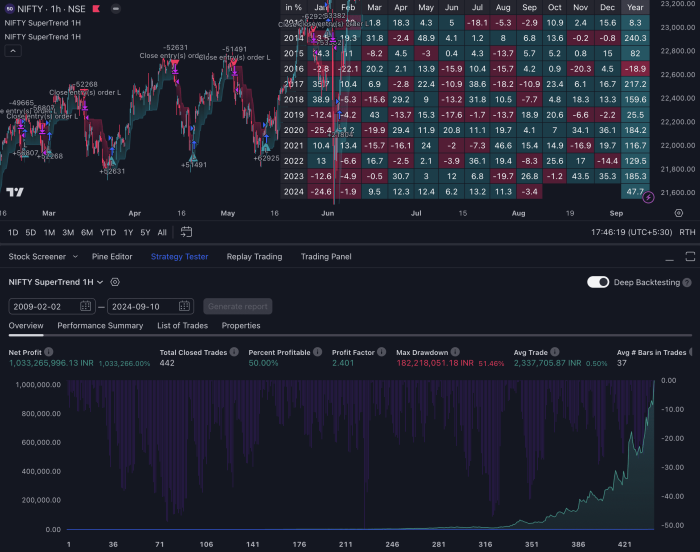
The Machine Learning Adaptive SuperTrend strategy is a powerful method for identifying trends. It combines traditional technical analysis with machine learning algorithms, allowing it to adjust to changing market conditions. This makes it especially effective in unpredictable situations.
Key Features and Approach:
- Adaptive Trend Detection: Unlike fixed trend indicators, this strategy uses machine learning to modify its settings based on past data. This helps it better identify market trends and reversals.
- Volatility Sensitivity: By including measures of volatility in its calculations, the strategy can tell the difference between regular price changes and major shifts in trends. This is particularly useful during times of high market instability.
Benefits for Traders:
- Improved Accuracy: The use of machine learning improves the precision of trend forecasts, reducing incorrect signals and leading to better trade results.
- Real-Time Adaptation: In fast-changing markets, being able to adjust quickly is essential. This strategy modifies its settings as needed, giving traders timely and useful information.
- Enhanced Risk Management: By ignoring minor fluctuations and concentrating on significant price changes, this strategy helps traders manage risk more effectively, preventing them from making trades based on small movements.
This combination of technical indicators and machine learning provides a strong tool for traders dealing with complex market situations. In fact, recent research has shown that incorporating advanced machine learning techniques into trading strategies significantly enhances their effectiveness. With its ability to adjust and focus on volatility, the Machine Learning Adaptive SuperTrend is a standout choice among the many trading strategies available on TradingView.
Smart Money Concepts Strategy
The Smart Money Concepts strategy is a unique approach that focuses on the actions and behaviors of institutional investors. This strategy aims to provide insights into how large financial institutions, often referred to as “smart money,” influence market movements. By understanding these patterns, you can make more informed trading decisions.
Key elements of this strategy include:
- Market Structure Analysis: This involves studying price patterns and trends to identify potential areas of support and resistance. These levels are crucial as they often indicate where institutional investors might enter or exit the market.
- Liquidity Levels: The strategy emphasizes the importance of liquidity, which refers to the ease with which assets can be bought or sold without affecting their price. Institutional traders typically operate in high-liquidity environments to minimize market impact and maximize efficiency.
Incorporating these factors allows the Smart Money Concepts strategy to provide a comprehensive framework for trading. By focusing on market structure and liquidity, this approach helps you align your trades with the actions of institutional investors, potentially leading to more profitable outcomes.
TradingView offers a variety of tools and scripts that facilitate this strategy. You can access user-generated content that delves deep into market structure analysis and liquidity levels, allowing you to tailor your approach based on real-time data and insights.
Understanding the behavior of institutional traders can give you an edge in the market. The Smart Money Concepts strategy leverages this understanding, making it a valuable addition to your trading toolkit on TradingView.
Creating Custom Strategies on TradingView with Pine Script
Developing custom strategies on TradingView involves using Pine Script, a powerful programming language specifically designed for the platform. By harnessing Pine Script, you can create personalized trading strategies that align with your unique trading style and objectives.
Step-by-Step Process for Creating Personalized Trading Strategies
1. Open the Pine Editor
Start by opening the Pine Editor, which can be found at the bottom of the TradingView interface.
2. Write Your Script
Begin by defining your strategy’s name and starting point using //@version=4 followed by strategy("My Custom Strategy", overlay=true).
3. Select Indicators
Choose technical indicators that will drive your strategy. For example, you can use moving averages with ma = sma(close, 14) for a 14-period simple moving average.
4. Define Entry and Exit Rules
Establish conditions for entering and exiting trades. Use conditional statements such as if (crossover(ma, close)) strategy.entry("Buy", strategy.long) for a buy signal when the price crosses above the moving average.
5. Incorporate Risk Management
Integrate risk management parameters like stop-loss and take-profit levels using strategy.exit("Take Profit", "Buy", limit=targetPrice).
6. Test and Refine
Run backtests to evaluate performance and refine your script based on historical data.
Example of a Simple Moving Average Strategy
pine //@version=4 strategy(“Simple Moving Average Strategy”, overlay=true) ma = sma(close, 14) if (crossover(close, ma)) strategy.entry(“Buy”, strategy.long) if (crossunder(close, ma)) strategy.close(“Buy”)
This basic script sets up a simple moving average crossover strategy where trades are entered when the price crosses above a 14-period moving average and exited when it crosses below.
Selecting Indicators and Defining Entry/Exit Rules
When creating custom strategies, selecting the right indicators is crucial. Commonly used indicators include:
- Moving Averages: Useful for identifying trend directions.
- Relative Strength Index (RSI): Helps determine overbought or oversold conditions.
- Bollinger Bands: Assists in understanding market volatility.
Defining precise entry and exit rules ensures your strategy operates effectively under different market conditions. For instance, combining multiple indicators can filter out false signals and improve accuracy.
With Pine Script’s flexibility, traders can transform their trading ideas into actionable strategies on TradingView.
Backtesting Strategies in TradingView
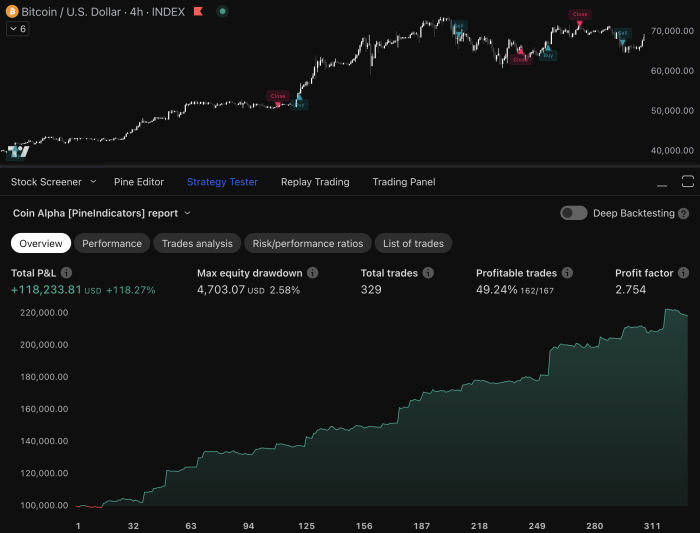
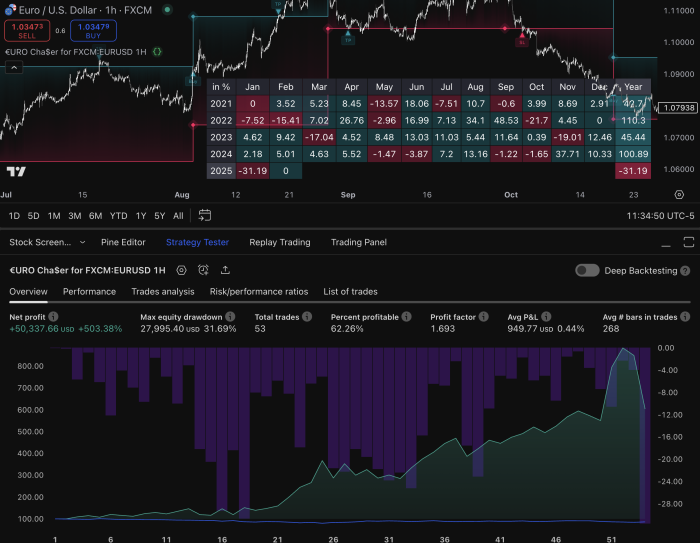
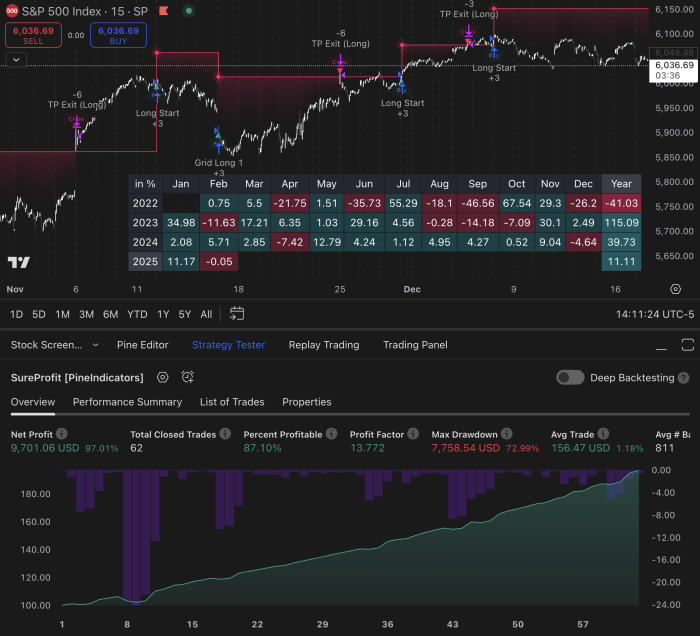
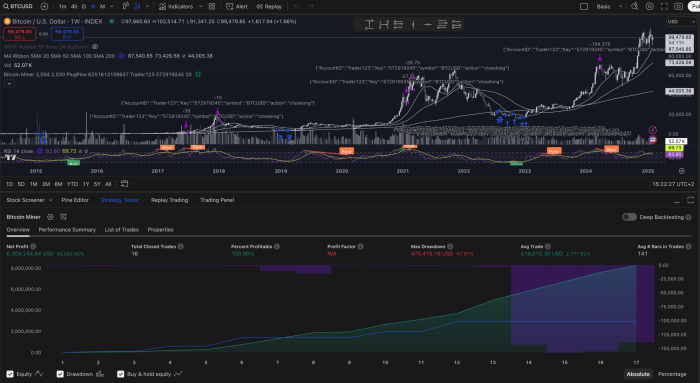
Backtesting strategies is crucial for validating the performance and reliability of your trading strategies before deploying them live. By simulating trades using historical data, you can gain insights into how a strategy would have performed under real market conditions, identifying potential strengths and weaknesses.
Importance of Backtesting
- Performance Validation: Backtesting provides a quantitative basis to evaluate the effectiveness of a trading strategy.
- Risk Management: Helps in understanding the risk associated with a strategy by analyzing drawdowns and other risk metrics.
- Confidence Building: Boosts confidence in the strategy’s viability, allowing you to trade with greater assurance.
Conducting Effective Backtesting on TradingView
1. Set Up Historical Data
- Choose the financial instrument and time frame for your backtest.
- Ensure you have sufficient historical data to cover various market conditions.
2. Script Your Strategy Using Pine Script
- Define your entry and exit rules clearly.
- Incorporate any technical indicators or custom conditions relevant to your strategy.
3. Run the Backtest
- Use TradingView’s built-in backtesting feature within the Pine Script Editor.
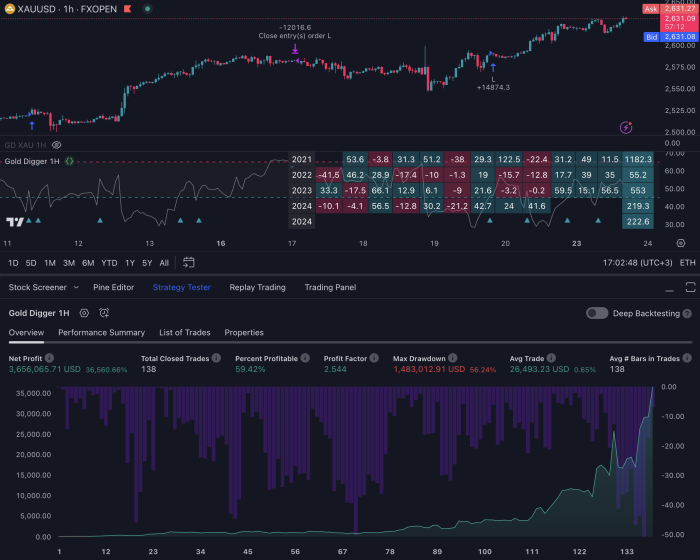
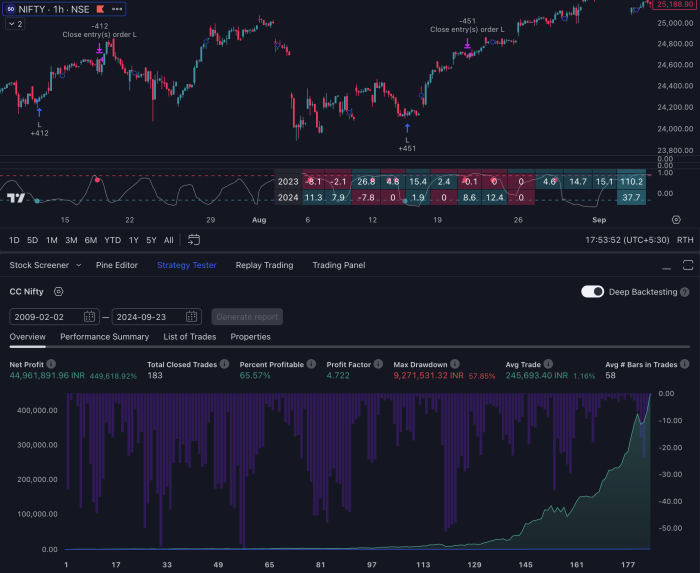
- Analyze the results provided by TradingView, which include key metrics like profit factor, win rate, and maximum drawdown.
4. Analyze Results
- Examine detailed performance metrics and visual charts that illustrate trade entries, exits, and overall profitability.
- Identify any adjustments needed to optimize the strategy based on backtest outcomes.
By integrating these steps into your strategy development process, you ensure that your approach has been rigorously tested against historical data, providing a solid foundation for live trading decisions.
Community and Resources on TradingView
One of the best things about TradingView is its community-driven repository. This lively community helps traders create and improve their strategies using various interactive tools:
Interactive Tools for Traders
1. Forums
Join discussion forums to connect with other traders. Here, you can:
- Share insights
- Ask questions
- Get feedback on your trading ideas
These forums cover a wide range of topics, from beginner tips to advanced trading techniques. For instance, you might find discussions on running the same strategy on multiple charts, which can be particularly useful for traders looking to optimize their strategies.
2. Social Sharing Options
Directly from the platform, you can:
- Share your charts, strategies, and analyses with the TradingView community
- Follow other traders to see their shared ideas
This fosters a collaborative environment where everyone can learn from each other.
3. User-Generated Scripts
Explore an extensive library of over 100,000 user-generated scripts, including:
- Custom indicators
- Complete trading strategies created by other traders using Pine Script
You’ll find everything from simple moving averages to complex machine learning models. For example, some users share high-profit options trading charts that can be adapted for platforms like Thinkorswim, as seen in this high profit options trading chart for Thinkorswim.
Benefits of Engaging with the Community
By actively participating in this community, you can enjoy several advantages:
1. Diverse Perspectives
Gain insights from traders with different levels of experience and various trading styles. This diversity helps you spot market opportunities that you might have missed on your own.
2. Learning Opportunities
Discover new trading techniques and strategies by studying the shared scripts and ideas. Many experienced traders explain their thought processes and provide detailed instructions on how to use their scripts effectively.
3. Efficiency
Save time by leveraging existing strategies and indicators. Instead of building everything from scratch, you can modify user-generated scripts to suit your specific needs.
TradingView’s community features make it more than just a trading platform; it becomes a collaborative space where you can continuously improve your trading skills.
Moreover, if you’re considering comparing different platforms for your trading needs, resources like this NinjaTrader vs Thinkorswim comparison could provide valuable insights into which platform may suit your trading style better.
Conclusion
TradingView offers a wide range of trading strategies that can greatly improve your trading efforts. Using these tools allows you to customize your approach based on different market conditions and personal trading styles.
To achieve success, it’s important to:
- Use Different Strategies: TradingView provides various options, such as technical indicators and machine learning algorithms, to meet different trading goals and market situations.
- Try and Discover: Don’t be afraid to experiment with different strategies like the N Bar Reversal Detector or the Opening Range Breakout. Each strategy has its own benefits and insights.
- Focus on Risk Management: Managing risks effectively is crucial. Make sure that every strategy you use includes measures to protect your money.
Participate in the TradingView community, exchange ideas, and constantly improve your strategies by learning from others. By combining these elements, you can create a strong trading plan that increases your overall success in the financial markets.
FAQs (Frequently Asked Questions)
What is TradingView and why is it popular among traders?
TradingView is a widely used trading platform that offers advanced charting tools, social networking features, and a variety of technical indicators. Its popularity stems from its user-friendly interface, extensive community support, and the ability to create and share trading strategies.
What are trading strategies and why are they important?
Trading strategies are systematic methods that traders use to make decisions in the financial markets. They provide a clear plan for entering and exiting trades, which helps traders manage risk and improve their chances of success. Having effective trading strategies is crucial for navigating market volatility.
What types of trading strategies can I find on TradingView?
TradingView offers a variety of trading strategies including technical indicators-based strategies, notable strategies like the N Bar Reversal Detector, Opening Range Breakout, Machine Learning Adaptive SuperTrend, and Smart Money Concepts strategy. Each strategy has unique features tailored to different market conditions.
How can I create custom trading strategies on TradingView?
You can create custom trading strategies on TradingView using Pine Script, which is the platform’s programming language. The process involves selecting indicators and defining entry and exit rules in your scripts, allowing you to tailor your strategy to your specific trading goals.
Why is backtesting important in trading?
Backtesting is essential for validating the performance and reliability of your trading strategies before implementing them in live markets. It allows traders to test their strategies against historical data to assess how they would have performed under various market conditions.
What community resources does TradingView offer for traders?
TradingView has a vibrant community that includes forums, social sharing options, and an extensive library of user-generated scripts. These resources allow traders to collaborate, share insights, and access a wide range of tools that can enhance their strategy development.

