Introduction
TradingView has become a go-to platform for traders worldwide, offering advanced charting tools and a user-friendly interface. Its significance lies in its ability to provide real-time data, comprehensive market analysis, and customizable charting options that cater to both beginners and seasoned traders alike.
One of TradingView’s standout features is Pine Script, a powerful scripting language designed for creating custom indicators and strategies. Pine Script enables you to develop unique trading tools tailored to your specific needs. Whether you want to create simple moving averages or complex trading algorithms, Pine Script offers the flexibility and functionality to bring your ideas to life.
This article serves as a comprehensive beginner’s guide to TradingView scripts, aiming to equip you with the knowledge needed to use Pine Script effectively. You will learn about the basics of Pine Script, how to get started with TradingView scripts, and explore various types of scripts and their applications. By the end of this guide, you’ll be ready to start experimenting with your own custom indicators and strategies.
Understanding Pine Script
Pine Script is a lightweight programming language specifically created by TradingView. Its main goal is to let traders create their own indicators and strategies directly on the TradingView platform. Designed to be simple, Pine Script makes it easy for users to develop personalized tools that can be seen on their trading charts.
Why Pine Script is User-Friendly
For beginners in coding, Pine Script stands out as particularly user-friendly due to its straightforward syntax and structure. Unlike more complex programming languages, Pine Script’s code is easy to read and write. This accessibility helps traders who might not have extensive programming experience to start creating their own scripts quickly.
Benefits of Using Pine Script
By using Pine Script, traders can:
- Create Custom Indicators: Design unique tools tailored to specific trading strategies.
- Backtest Strategies: Simulate trades based on predefined rules over historical data.
- Visualize Data: Plot custom indicators directly onto TradingView charts for real-time analysis.
- Automate Calculations: Perform complex calculations effortlessly, aiding in technical analysis.
These features empower traders to improve their strategies and make better decisions based on customized analytical tools. Furthermore, when compared to other programming languages often used in trading such as MQL4 or MQL5, Pine Script offers distinct advantages that enhance the overall trading experience.
Getting Started with TradingView Scripts
Signing Up for a Free TradingView Account
To begin using TradingView scripts, you need to set up a free TradingView account. The process is straightforward:
- Visit the TradingView Website: Navigate to TradingView.
- Create an Account: Click on the “Sign Up” button and fill in your details or use existing social media accounts for quick registration.
- Confirm Your Email: Check your email for a confirmation link and follow the instructions to verify your account.
Once your account is set up, you can access TradingView’s powerful charting tools.
Accessing Charting Tools
- Open the Charting Platform: After logging in, click on “Chart” from the main menu.
- Explore Available Tools: Utilize various chart types, drawing tools, and technical indicators available within the platform to enhance your trading analysis. For a comprehensive understanding of how to effectively use these tools, consider following this detailed tutorial.
Introduction to the Pine Editor
The Pine Editor is where you write and edit your scripts on TradingView. To access it:
- Open a Chart: Navigate to any active chart.
- Access Pine Editor: At the bottom of the screen, locate and click on the “Pine Editor” tab.
In the Pine Editor, you can create new scripts or modify existing ones. It provides an intuitive interface designed specifically for writing Pine Script code based on this comprehensive Pine Script trading guide. Here’s what you’ll find:
- Script Area: The main space where you write your script.
- Toolbar: Contains options to save, publish, and apply scripts.
- Output Panel: Displays errors or messages generated by your code.
By following these steps, you’ll be well-prepared to start scripting on TradingView effectively. If you’re interested in creating a simple trading strategy using TradingView, this resource could provide valuable insights.
Creating Your First Basic Script: A Step-by-Step Guide
Creating your first basic script on TradingView may seem daunting, but with a straightforward example, you’ll grasp the essentials quickly. Let’s walk through creating a simple moving average script from scratch.
Step 1: Open Pine Editor
After signing in to TradingView, open any chart and click the Pine Editor tab at the bottom of the screen.
Step 2: Define Script Properties
pine //@version=4 study(“Simple Moving Average”, shorttitle=”SMA”, overlay=true)
@version=4specifies the Pine Script version.study(...)defines the indicator’s name and properties. Here,"Simple Moving Average"is the full title,"SMA"is the short title, andoverlay=truemeans it will be drawn on the price chart.
Step 3: Calculate Moving Average
pine length = input(14, minval=1, title=”Length”) sma = sma(close, length)
input(...)allows you to customize the moving average period via a user interface.sma(close, length)calculates the simple moving average based on closing prices and the specified period.
Step 4: Plot Result
pine plot(sma, title=”SMA Line”, color=color.blue)
plot(...)draws the moving average line on the chart in blue.
Step 5: Complete Script
pine //@version=4 study(“Simple Moving Average”, shorttitle=”SMA”, overlay=true)
length = input(14, minval=1, title=”Length”) sma = sma(close, length)
plot(sma, title=”SMA Line”, color=color.blue)
Save and apply this script to your chart. You now have a basic simple moving average indicator that can be customized using input parameters directly from TradingView’s interface. This foundational knowledge will help you explore more complex scripts and strategies as you advance.
Exploring Different Types of Scripts in Pine Script
Commonly Used Studies in Pine Script: Enhancing Technical Analysis with Indicators
TradingView’s Pine Script offers a variety of studies, or non-backtesting scripts, that enhance technical analysis. These studies are essential for traders who want to analyze price movements without relying solely on historical data.
Popular Studies in Pine Script
Moving Averages
One of the most common indicators, moving averages smooth out price data to help identify trends over specific periods. Pine Script allows you to create various types of moving averages, such as:
- Simple Moving Average (SMA): This is calculated by taking the arithmetic mean of a given set of prices over a specified number of periods.
- Exponential Moving Average (EMA): This gives more weight to recent prices, making it more responsive to new information.
Bollinger Bands
These consist of a middle band (usually an SMA) and two outer bands that are standard deviations away from the middle band. Bollinger Bands help traders understand volatility and identify potential buy or sell signals.
Relative Strength Index (RSI)
An oscillator that measures the speed and change of price movements. RSI ranges from 0 to 100 and helps identify overbought or oversold conditions in a market.
MACD (Moving Average Convergence Divergence)
This is used to identify changes in the strength, direction, momentum, and duration of a trend. It consists of two moving averages that oscillate around a zero line.
These studies allow traders to visualize essential data points directly on their charts, assisting them in making informed decisions.
Benefits of Using Studies
Studies offer several advantages for traders:
- Real-Time Analysis: Unlike strategies that backtest historical data, studies provide real-time analysis. This helps traders react swiftly to market changes.
- Visual Clarity: By plotting indicators like moving averages or Bollinger Bands on charts, traders can easily spot trends and potential reversal points.
- Versatility: You can combine multiple studies to create comprehensive trading systems tailored to your style and preferences.
For example, you might use an EMA crossover strategy along with RSI to confirm trends and avoid false signals.
Understanding the difference between studies and strategies is crucial when working with Pine Script. While studies focus on real-time data analysis, strategies enable backtesting using predefined rules. This distinction helps you choose the right tool for your specific needs in technical analysis.
By leveraging popular studies within Pine Script, you can enhance your trading toolkit and make better-informed decisions based on current market conditions rather than solely relying on historical data for insights.
Backtesting Your Trading Ideas Effectively with Strategies in Pine Script
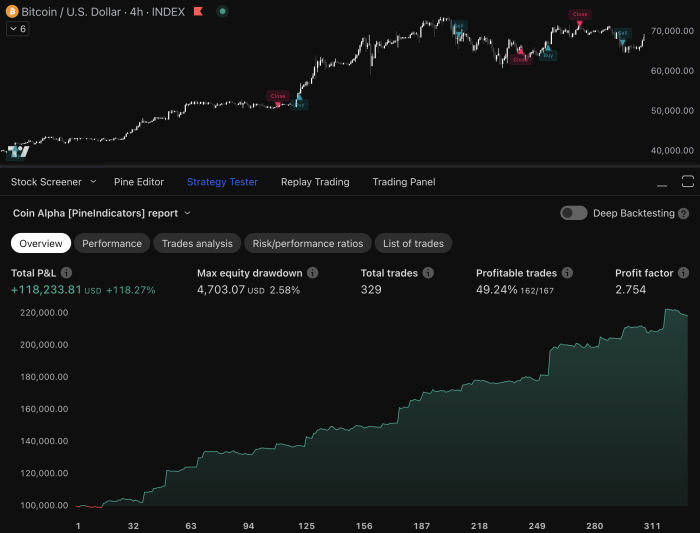
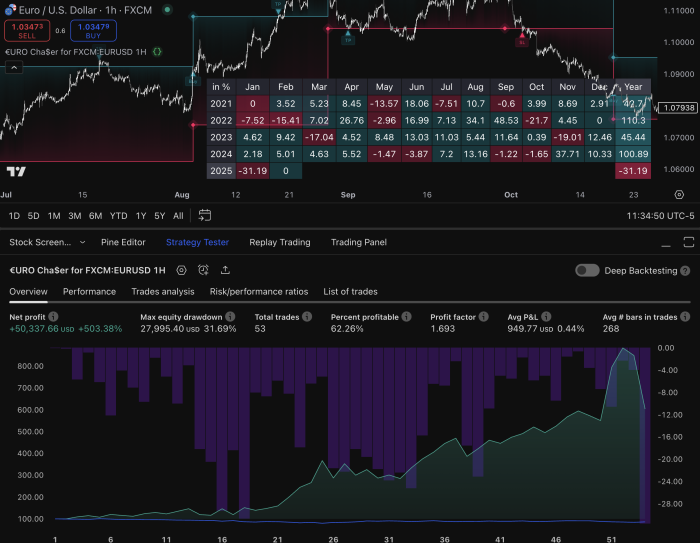
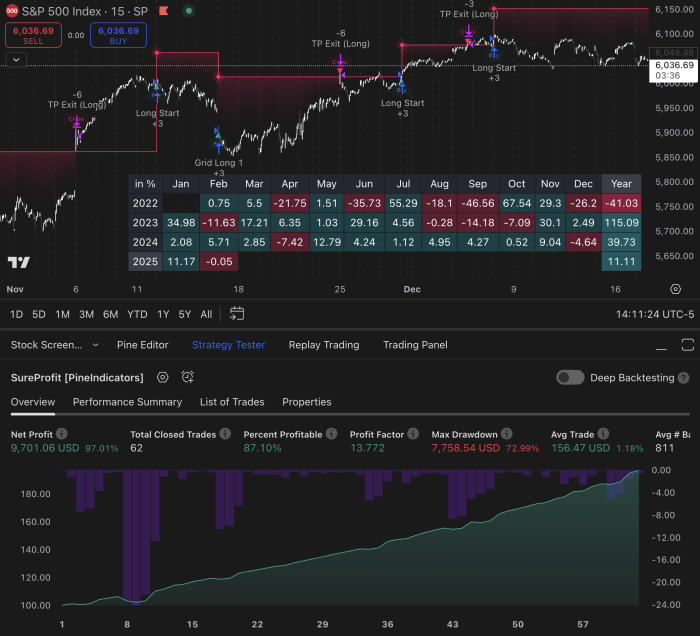
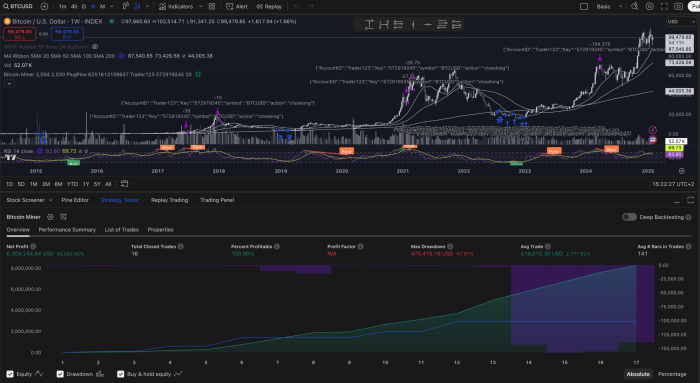
In Pine Script, strategies differ fundamentally from studies (indicators). While studies are primarily used for technical analysis tools like moving averages and other non-backtesting scripts, strategies are designed to simulate trades based on predefined rules. This capability allows you to evaluate the potential success of your trading ideas over past market conditions.
Key Features of Strategies:
- Buy/Sell Order Calls: Using built-in functions such as
strategy.entry,strategy.exit, andstrategy.close, you can define specific conditions under which trades should be executed. - Predefined Rules: You can set criteria for entering and exiting trades, such as certain price levels or indicator thresholds.
- Performance Metrics: Pine Script strategies provide detailed performance metrics, including profit/loss ratios, drawdown percentages, and more.
Example Scenario
Imagine you have a hypothesis that buying when a stock’s price crosses above its 50-day moving average and selling when it crosses below will be profitable.
- Define Entry Condition: Use
sma(close, 50)to calculate the 50-day moving average. - Set Buy Rule: Use
if (crossover(close, sma_50)) strategy.entry("Buy", strategy.long). - Set Sell Rule: Use
if (crossunder(close, sma_50)) strategy.close("Buy").
This simple example shows how strategies let you backtest trading ideas effectively using TradingView scripts for beginners. By exploring both studies vs strategies, you can use technical indicators not just for analysis but also for simulating real trade scenarios.
Using Built-in Functions for Technical Analysis in Pine Scripts
Built-in functions in Pine Script are powerful tools that allow you to perform common technical analysis tasks with ease. These functions simplify calculations and can be directly implemented into your scripts without the need for complex coding.
Key Built-in Functions
1. Simple Moving Average (SMA)
The sma function calculates the average price over a specified number of bars.
pinescript // Example: Calculating a 14-period SMA sma_close = sma(close, 14) plot(sma_close, title=”SMA 14″, color=color.blue)
This function is particularly useful for identifying trends and smoothing out price data.
2. Exponential Moving Average (EMA)
The ema function gives more weight to recent prices, making it more responsive to new information.
pinescript // Example: Calculating a 14-period EMA ema_close = ema(close, 14) plot(ema_close, title=”EMA 14″, color=color.red)
Traders often use EMA to identify potential entry and exit points based on its quicker reaction to market changes.
3. Relative Strength Index (RSI)
The rsi function measures the speed and change of price movements.
pinescript // Example: Calculating a 14-period RSI rsi_value = rsi(close, 14) plot(rsi_value, title=”RSI 14″, color=color.green)
RSI helps traders determine overbought or oversold conditions.
4. Bollinger Bands
The bollinger function calculates bands based on standard deviations around a moving average.
pinescript // Example: Bollinger Bands with a 20-period moving average and standard deviation of 2 [up_band, mid_band, low_band] = bollinger(close, 20, 2) plot(up_band, title=”Upper Band”, color=color.orange) plot(mid_band, title=”Middle Band”, color=color.blue) plot(low_band, title=”Lower Band”, color=color.orange)
These bands provide insights into volatility and potential price breakouts.
Using these built-in functions allows you to create sophisticated indicators with minimal effort, enhancing your technical analysis capabilities on TradingView.
Understanding Execution Model and Limitations of Using Pine Scripts on Trading View
Execution Model
Pine scripts execute based on historical bars and adapt dynamically to real-time price changes during live market sessions. This dual functionality allows you to backtest strategies effectively while also seeing how they perform in real time. When a script runs, it processes each bar from the historical data sequentially, calculating values and triggering events as specified in your code. During live trading, the script updates with each new price tick, ensuring that your indicators and strategies remain responsive.
Common Limitations
Despite its powerful features, Pine Script has some limitations:
- Restricted Data Feeds: Pine Script is confined to the data provided by TradingView. External data sources or custom feeds cannot be integrated into your scripts.
- Lack of External Libraries: The language does not support external libraries or frameworks, such as machine learning tools. This means you are limited to the built-in functions and capabilities of Pine Script itself.
- Execution Constraints: Scripts are executed on a bar-by-bar basis, which may not be suitable for high-frequency trading needs.
- Resource Limits: There are constraints on the number of calculations and memory usage per script, which can impact complex strategies.
Understanding these limitations is crucial for developing realistic and effective trading strategies using Pine Script.
Customizing Your Scripts and Learning from Community Resources
Customizing TradingView scripts enhances their flexibility and usability. Input functions are particularly useful, allowing you to modify parameters directly via the user interface without altering the code structure. For instance, you can add an input function to change the period of a moving average:
pine //@version=4 study(“Custom Moving Average”, overlay=true) length = input(14, minval=1, title=”MA Length”) src = close ma = sma(src, length) plot(ma, color=color.blue)
In this script, the length of the moving average can be adjusted directly through the settings panel in TradingView.
Exploring the extensive public library on TradingView is another excellent way to learn. This library contains a wealth of open-source scripts shared by other members of the community. Browsing through these scripts helps beginners understand different coding techniques and strategies. You can access this resource by navigating to TradingView’s “Public Library” section under indicators.
Benefits of Using Community Resources
- Diverse Examples: Access a variety of scripts for different trading strategies.
- Learning by Doing: Modify existing scripts to see how changes affect outcomes.
- Community Support: Engage with other users to get feedback and tips.
Leverage these resources to deepen your understanding and improve your scripting skills on TradingView.
Conclusion
You now have the basic knowledge needed to start experimenting with your own custom indicators and strategies using TradingView scripts. This is just the beginning of your journey into TradingView scripts.
Join the active TradingView community, where you can keep learning and find traders who are eager to help each other. Embrace this new skill set and explore the many opportunities that Pine Script provides to improve your trading experience.
FAQs (Frequently Asked Questions)
What is TradingView and why is it significant for traders?
TradingView is a powerful platform that provides advanced charting tools and social networking features for traders. It allows users to analyze financial markets, share insights, and create custom indicators using Pine Script, making it an essential resource for both beginners and experienced traders.
What is Pine Script and how does it benefit traders?
Pine Script is a lightweight programming language designed specifically for creating custom indicators and strategies on TradingView. It is user-friendly, particularly for beginners in coding, and allows traders to enhance their trading strategies by developing personalized tools tailored to their needs.
How do I set up a TradingView account?
To set up a TradingView account, simply visit the TradingView website and follow the step-by-step guide to sign up for a free account. Once registered, you can access the platform’s powerful charting tools and start exploring Pine Script through the Pine Editor.
What are the different types of scripts available in Pine Script?
Pine Script offers two main categories of scripts: studies (indicators) and strategies (backtesting). Studies are used for technical analysis without backtesting, while strategies allow users to simulate trades based on predefined rules over past market conditions.
How can I customize my scripts in Pine Script?
Customization in Pine Script can be achieved through input functions, which allow users to modify parameters directly via the user interface without altering the underlying code structure. Additionally, there is an extensive public library where users can find open-source scripts shared by other members of the TradingView community.
What are some common limitations when using Pine Scripts on TradingView?
While Pine Scripts are powerful, they do have some limitations. These include restricted access to certain data feeds and a lack of support for external libraries like machine learning frameworks. It’s important for traders to understand these limitations when developing their scripts.

