Introduction
TradingView is a top trading platform that offers a wide range of tools for technical analysis and stock strategies. With its easy-to-use interface and active community, TradingView allows traders to discover and apply various strategies suited to their trading preferences.
Having effective stock strategies is essential in the unpredictable world of trading. They provide a structured approach that can improve decision-making, reduce risks, and increase profits. Whether you’re new to trading or have years of experience, having a clear strategy is key to achieving consistent results.
In this article, you’ll learn about:
- Popular TradingView stock strategies
- Ways to customize your own trading strategies on TradingView
- Harnessing the power of community contributions
By the end, you’ll have practical knowledge to enhance your trading skills on TradingView.
Understanding Trading Strategies
Trading strategies are predefined plans or sets of rules that traders follow to make decisions about buying and selling stocks. They provide a structured approach to market analysis, ensuring consistency and objectivity in trading activities.
A well-defined strategy helps you to:
- Identify optimal entry and exit points
- Manage risk effectively
- Maintain discipline during volatile market conditions
Trader psychology plays a crucial role in the selection and execution of trading strategies. Emotional responses such as fear and greed can significantly impact decision-making processes. A structured strategy helps mitigate these psychological biases by providing clear guidelines to follow, regardless of market conditions.
Different traders may prefer different strategies based on their psychological makeup:
- Risk-tolerant traders might gravitate towards high-risk, high-reward strategies.
- Risk-averse traders often prefer conservative approaches with lower potential for loss.
Understanding your own psychology is key to choosing a strategy that aligns with your trading goals and temperament. This alignment not only improves your chances of success but also makes the trading experience more enjoyable and less stressful.
1. Popular TradingView Stock Strategies
1.1 Bollinger Bands Strategy
Bollinger Bands are a versatile tool in the world of stock trading, providing insights into market volatility and potential price movements. They consist of three lines:
- The middle band, which is a simple moving average (SMA).
- The upper band, set two standard deviations above the SMA.
- The lower band, set two standard deviations below the SMA.
These bands expand and contract based on market volatility, offering visual cues about potential entry and exit points.
Combining Bollinger Bands with other indicators like RSI (Relative Strength Index) or MACD (Moving Average Convergence Divergence) can enhance their effectiveness. For example:
- RSI: When prices hit the lower Bollinger Band and the RSI indicates an oversold condition, it may signal a buying opportunity.
- MACD: A bullish crossover in the MACD near the lower Bollinger Band can also suggest a potential buy signal.
Advantages of using this strategy include:
- Volatility Insight: Helps traders understand market volatility.
- Clear Signals: Provides clear visual signals for potential trades.
- Flexibility: Can be combined with various other indicators for more robust strategies.
Limitations to consider:
- False Signals: May produce false signals in ranging markets.
- Lagging Nature: As a lagging indicator, it might not predict price movements promptly.
Overall, mastering the Bollinger Bands strategy on TradingView involves understanding how these bands react to market conditions and leveraging additional indicators for confirmation.
1.2 Opening Range Breakout Strategy
The Opening Range Breakout strategy relies on the initial price range set during the first trading period of a session. This range often influences market sentiment and potential price movement throughout the day.
To identify the opening range:
- Look at the highest and lowest prices within a specific time frame, usually the first 30 minutes to one hour after the market opens.
- Mark these levels as important support and resistance zones.
Possible trade signals occur when:
- The price goes above the upper boundary of the opening range, indicating upward momentum and a possible buying opportunity.
- The price goes below the lower boundary, showing downward sentiment and a potential sell signal.
This strategy takes advantage of early market volatility, aiming to benefit from significant trends triggered by initial trading activity.
1.3 Price Action Strategies
Price action trading focuses on interpreting raw market data to make trading decisions, avoiding complex indicators. This method relies heavily on support and resistance levels, trend lines, and common candlestick patterns.
Key Elements of Price Action Trading:
- Support and Resistance Levels: These are price points where the stock tends to reverse or pause. Traders often look for breakouts or reversals around these levels.
- Trend Lines: Drawing trend lines helps identify the general direction of the market. An upward trend line indicates a bullish market, while a downward trend line signals bearish conditions.
- Candlestick Patterns: Common formations like Doji, Hammer, and Engulfing patterns provide visual cues about potential market movements.
Analyzing these elements allows traders to gauge market sentiment and make informed decisions without relying on tools like Bollinger Bands, RSI, or MACD. This minimalist approach can be effective in various market conditions, offering flexibility and simplicity.
1.4 Machine Learning Adaptive Indicators Strategy
Machine learning is transforming stock trading strategies by providing adaptive indicators that adjust to changing market conditions. These strategies leverage historical data patterns to predict future price movements, offering a dynamic approach to trading.
Key Features:
- Data-Driven Analysis: Machine learning algorithms analyze vast amounts of historical data to identify patterns and trends.
- Adaptive Indicators: Unlike static indicators, adaptive indicators adjust their signals based on real-time market conditions.
- Predictive Accuracy: These strategies aim to improve predictive accuracy by continuously learning from new data.
Examples of Use:
- Volatility Adjustments: Machine learning can modify Bollinger Bands or other volatility-based indicators to better reflect current market conditions.
- Optimized Entry/Exit Points: Adaptive indicators can refine entry and exit points by combining signals from RSI, MACD, and other traditional tools.
TradingView’s platform supports the integration of machine learning algorithms through custom scripts, enabling you to develop and test these advanced strategies directly within its interface.
1.5 Volume Analysis Strategies
Volume plays a crucial role in understanding market behavior and potential reversals. By examining the buying and selling volumes, you can gain insights into market strength and the conviction behind price movements.
Key Techniques:
- Volume Spikes: Identifying significant increases in volume that may indicate strong buying or selling interest.
- Volume Moving Averages: Using moving averages of volume to smooth out data and identify trends over time.
- Volume by Price (VbP): Analyzing volume distribution at different price levels to detect potential support and resistance zones.
Combining these techniques with other indicators like Bollinger Bands, RSI, or MACD enhances the reliability of your TradingView stock strategies. Understanding volume helps validate trading signals and refine entry/exit points, making it an invaluable tool in your trading arsenal. Moreover, staying updated with current market trends is essential for successful trading.
Customizing Your Own Trading Strategies on TradingView
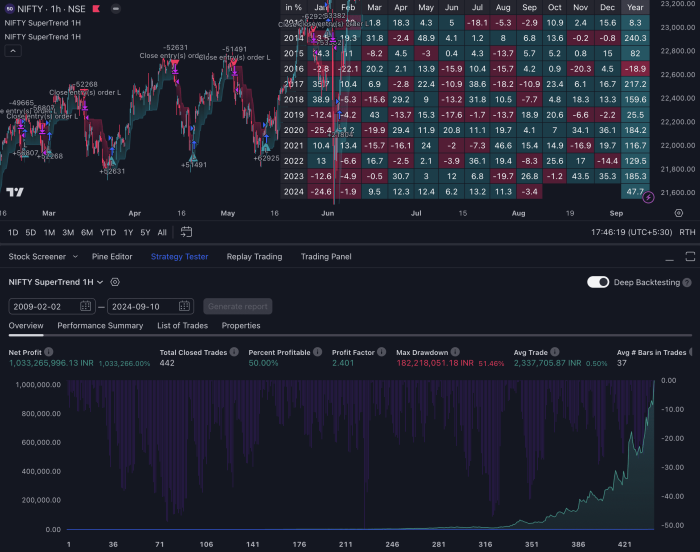
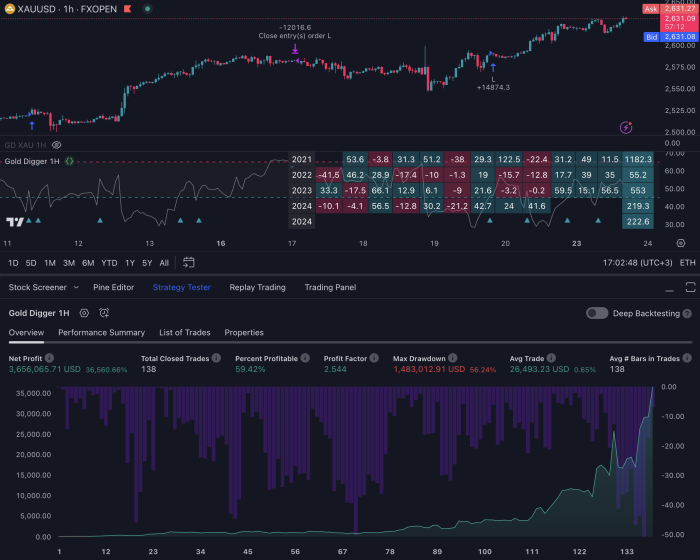
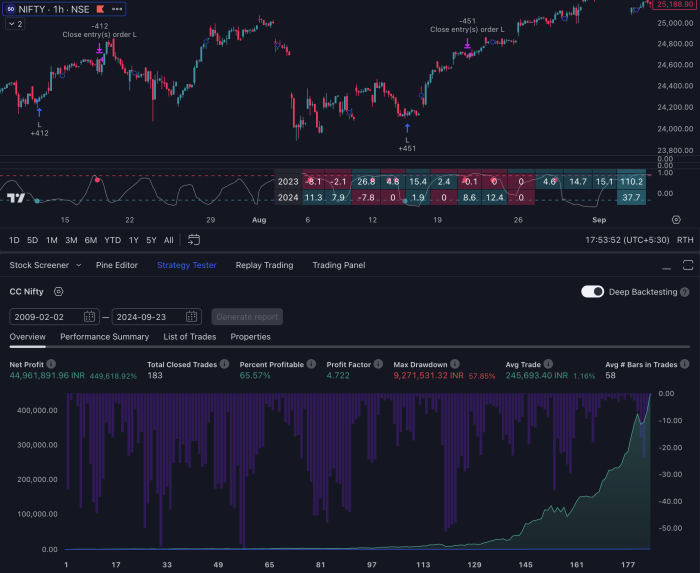
Customizing trading strategies on TradingView offers unparalleled flexibility. You can create personalized strategies using custom scripts or a combination of existing indicators. TradingView supports Pine Script™, a powerful scripting language designed specifically for technical analysis.
Key Benefits
1. Tailored Analysis
Customize indicators to align with your unique trading style. Whether you prefer simple moving averages or more complex machine learning models, Pine Script™ allows for precise modifications.
2. Strategy Backtesting
Evaluate the effectiveness of your strategies by backtesting them against historical data. This helps in understanding potential performance before applying them in real-time trading.
3. Combining Indicators
Mix and match different indicators to create robust trading signals. For instance, combining Bollinger Bands with RSI can help in identifying more reliable entry and exit points.
4. Automation
Automate your strategies to execute trades based on predefined conditions. This reduces emotional decisions and enhances consistency.
Example Use-Cases
- Custom Alerts: Set up alerts for specific market conditions like price breakouts or volume spikes.
- Adaptive Strategies: Develop indicators that adapt to changing market conditions, enhancing responsiveness to market trends.
- Community Scripts: Leverage shared scripts from the TradingView community as a foundation for your custom strategies.
TradingView’s customization capabilities empower traders to craft strategies that fit their trading philosophies and risk tolerance, ensuring a more personalized and effective trading experience.
Harness the Power of Community Contributions
The TradingView community contributions play a vital role in enriching the platform. Traders from around the globe contribute their expertise by sharing scripts, strategies, and indicators. This collaborative environment fosters innovation and allows you to leverage collective knowledge.
Shared Scripts and Strategies
The community’s shared scripts are a treasure trove for traders. With over 100,000 custom scripts available, you can explore diverse TradingView stock strategies tailored to different market conditions:
- Custom Indicators: Discover unique indicators developed by experienced traders that may provide new insights into market trends.
- Strategy Templates: Utilize pre-built strategy templates to test and refine your trading approach.
- Educational Resources: Access tutorials and guides that offer step-by-step instructions on implementing various strategies.
Collaborative Resources
Engaging with the community also means benefiting from collaborative resources:
- Forums and Discussions: Participate in discussions to gain different perspectives and solutions to common trading challenges.
- User Reviews: Read reviews and feedback on specific scripts or strategies to understand their effectiveness.
- Live Streams and Webinars: Join live sessions where seasoned traders share their methodologies and real-time trading experiences.
Leveraging these community contributions can significantly enhance your trading skills and strategy development. This collaborative spirit ensures that you are never alone in your trading journey, always having access to a wealth of knowledge and support.
Conclusion
Using effective trading strategies on TradingView is crucial for your growth as a trader. By consistently learning, trying out new methods, and adjusting different TradingView stock strategies, you can create a strong approach that fits your individual trading style. Get involved with the community, try out different indicators, and improve your techniques to boost your market analysis and decision-making abilities.
FAQs (Frequently Asked Questions)
What is TradingView and why is it important for traders?
TradingView is a powerful trading platform that offers various tools for technical analysis and market research. It is important for traders as it provides effective stock strategies, enabling them to make informed trading decisions and improve their overall trading performance.
What are some popular TradingView stock strategies?
Some popular TradingView stock strategies include Bollinger Bands, Opening Range Breakout, Price Action Strategies, Machine Learning Adaptive Indicators, and Volume Analysis Strategies. Each of these strategies utilizes different technical indicators and principles to identify potential trade opportunities.
How do Bollinger Bands work in trading?
Bollinger Bands are technical indicators that consist of a middle band (the moving average) and two outer bands that represent standard deviations from the average. They help traders identify volatility and potential price reversals. Combining Bollinger Bands with other indicators like RSI or MACD can enhance entry and exit points.
What is the significance of trader psychology in developing trading strategies?
Trader psychology plays a crucial role in strategy selection as it influences decision-making processes, risk tolerance, and emotional responses during trading. Understanding one’s psychological tendencies can help traders adopt more structured approaches to their strategies.
How can I customize my own trading strategies on TradingView?
TradingView offers flexibility for traders to create personalized strategies using custom scripts or combinations of indicators. This allows traders to tailor their approaches based on individual preferences, market conditions, and specific goals.
What role does the TradingView community play in stock trading?
The TradingView community enriches the platform by sharing scripts, ideas, and resources that benefit all traders. Collaborative contributions from community members facilitate knowledge exchange and provide diverse perspectives on stock strategies.

