Introduction
The TradingView Strategy Tester is an essential tool for traders, designed to evaluate and optimize trading strategies using historical data. By simulating trades based on past market conditions, the strategy tester provides valuable insights into potential performance before live deployment.
In this article, we’ll explore the features and benefits of the TradingView Strategy Tester, focusing on its role in backtesting and optimizing trading strategies.
What You’ll Learn
- Setting up your first strategy test
- Analyzing results
- Making adjustments based on performance metrics
Understanding the TradingView Strategy Tester
Definition and Purpose
The TradingView Strategy Tester is a powerful tool designed specifically for traders to evaluate and refine their trading strategies. It allows you to simulate trades based on historical data, providing valuable insights into how your strategies would have performed in the past. This evaluation process is crucial for identifying potential strengths and weaknesses before risking real capital.
Integration with Pine Script
A key feature of the TradingView Strategy Tester is its seamless integration with Pine Script, a domain-specific language used for writing custom indicators and strategies on TradingView. By leveraging Pine Script, you can:
- Create Custom Strategies: Write scripts that send, modify, or cancel buy/sell orders based on predefined conditions.
- Test Various Scenarios: Apply your scripts to different symbols and time intervals, allowing for tailored testing scenarios.
- Optimize Performance: Adjust parameters within your scripts to optimize performance metrics such as win rate and drawdown.
How It Works
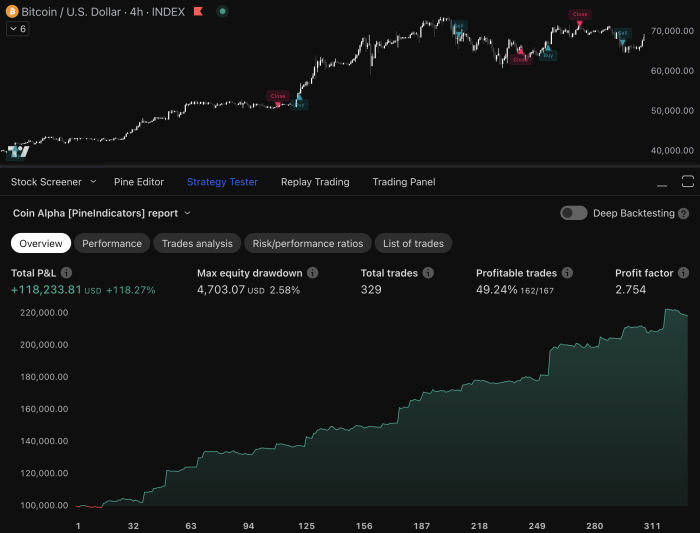
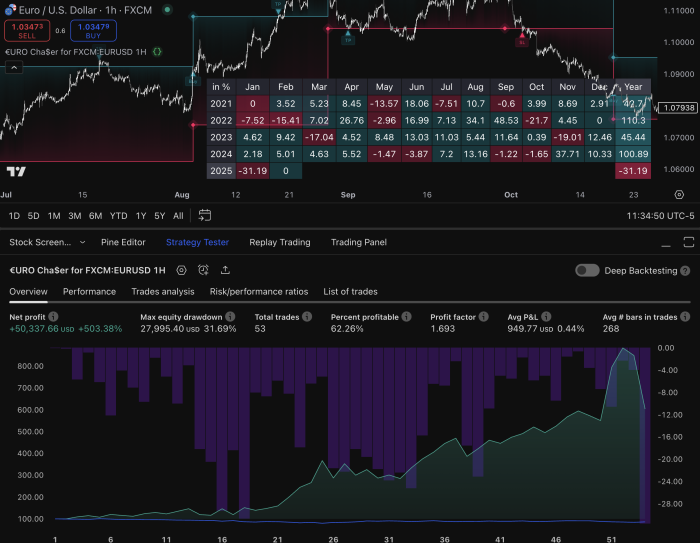
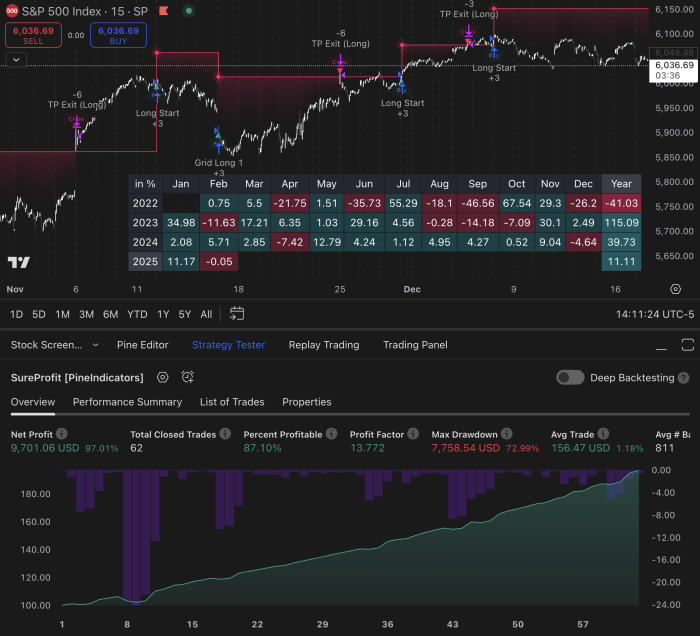
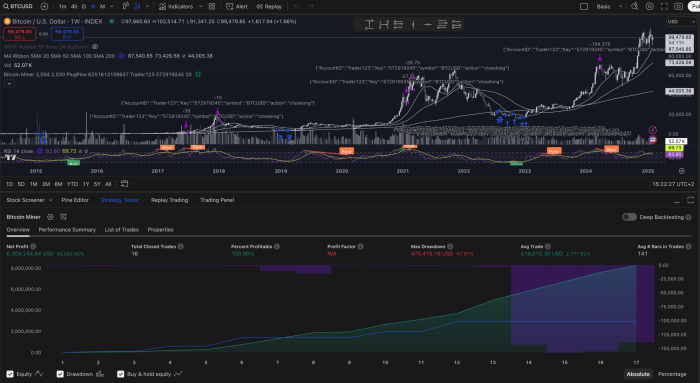
The Strategy Tester operates by running your Pine Script code against historical market data to simulate how your strategy would have performed. It provides a comprehensive performance analysis report that includes:
- Trade Summaries: Detailed lists of all executed trades during the testing period.
- Performance Metrics: Key metrics such as profit factor, maximum drawdown, and win rate.
- Visual Charts: Graphical representations of equity curves and other relevant performance indicators.
By integrating these features, the TradingView Strategy Tester offers a powerful platform for both novice and experienced traders to backtest, forward test, and fine-tune their trading strategies.
Key Features of the TradingView Strategy Tester
Backtesting
Backtesting is a crucial process for evaluating trading strategies, allowing you to simulate trades using historical data. This enables you to assess how your strategy would have performed in past market conditions. The process involves:
- Using Historical Data: Accessing extensive historical data is essential for accurate backtesting. TradingView provides a wide range of data across various timeframes and instruments.
- Setting Up Backtesting: To set up backtesting in TradingView, you need to create a strategy script using Pine Script. This script will define the rules for entering and exiting trades based on historical price movements.
- Performance Evaluation: Analyzing the results from backtesting helps identify strengths and weaknesses in your strategy. Key metrics such as win rate, average profit per trade, and maximum drawdown provide insights into your strategy’s profitability and risk.
Forward Testing
Forward testing involves testing your strategy in real-time with live market data. It’s different from backtesting as it allows you to observe how your strategy performs under current market conditions:
- Real-Time Data: By utilizing real-time data, you can see how your strategy reacts to ongoing market changes.
- Purpose of Forward Testing: This method helps validate the robustness of your strategy by ensuring it performs well not only on historical data but also in live trading environments.
- Benefits of Real-Time Observation: Forward testing provides immediate feedback on your strategy’s performance, helping you make timely adjustments if needed.
Performance Analysis
The TradingView Strategy Tester offers comprehensive performance analysis reports that help you evaluate the effectiveness of your trading strategies:
- Key Metrics: Focus on crucial metrics such as:
- Win Rate: The percentage of winning trades out of total trades executed.
- Drawdown: The peak-to-trough decline during a specific period, highlighting potential risks.
- Profitability Assessment: Evaluating net profit, gross profit, and gross loss to understand overall profitability.
- Trade Summary: The performance report includes a detailed summary of all trades executed during the test period. It provides insights into entry and exit points, trade durations, and profit or loss for each trade.
- Importance of Analysis: Thorough analysis helps identify patterns or anomalies in your strategy’s performance, guiding necessary adjustments for optimization.
These key features make the TradingView Strategy Tester an indispensable tool for traders looking to refine their strategies through rigorous evaluation processes.
Order Execution Simulation and Risk Management Tools in TradingView Strategy Tester
Order Execution Simulation
Order execution simulation is a crucial feature in the TradingView Strategy Tester. It ensures that your strategies are tested not just based on theoretical price points, but also on realistic market conditions.
Key aspects of order execution simulation include:
- Intrabar Price Movements: The simulation takes into account intrabar price movements, allowing for more accurate representation of order fills.
- Market Orders: These are executed immediately at the current market price. The simulation reflects this by filling market orders as soon as they are triggered.
- Limit Orders: These are placed to buy or sell at a specific price or better. The simulator ensures that limit orders are only filled when the market reaches the specified price.
By simulating fills based on actual price movements, you get a realistic view of how your strategy would perform in live trading. This helps identify potential issues such as slippage and partial fills that could impact profitability.
Risk Management Tools
Effective risk management is vital for any successful trading strategy. The TradingView Strategy Tester offers several features to help manage risk:
- Order Cancellation: You can set rules to automatically cancel orders under certain conditions. For example, if an order hasn’t been filled within a specified time frame, it can be canceled to avoid unwanted trades.
- Position Closure: Rules can be defined to close positions when specific criteria are met. This could include closing a position if it reaches a predefined profit target or stop loss level.
Examples of actions triggered by risk parameters:
- Stop Loss and Take Profit Levels: Automatically close trades when they hit predetermined stop loss or take profit levels. For instance, you can set stop loss levels to limit potential losses.
- Trailing Stops: Implement trailing stops that adjust stop loss levels dynamically based on market movements to lock in profits while minimizing losses.
- Exposure Limits: Set maximum exposure limits to ensure that no more than a certain percentage of your capital is at risk at any given time.
These tools allow you to create robust strategies that not only aim for profitability but also prioritize capital preservation and risk mitigation.
Common Backtesting Practices for Effective Results in TradingView Strategy Tester
To achieve effective backtesting results in TradingView, it’s important to follow certain best practices. Quality historical data and clear strategy definitions are fundamental components.
Best Practices
- Quality Historical Data: Ensuring the integrity of historical data is crucial. Reliable and comprehensive data sets allow for accurate simulations of past market conditions.
- Clear Strategy Definitions: Detailed and well-defined strategies help in producing consistent results. Clearly outline your trading rules, including entry and exit conditions, stop-loss, and take-profit levels.
Awareness of common pitfalls can save you from misleading results.
Common Pitfalls
- Overfitting: Avoid tailoring your strategy too closely to historical data, which might not perform well under new market conditions. Use out-of-sample data to validate your strategy.
- Neglecting Costs: Incorporate trading costs such as commissions and slippage into your backtests. Ignoring these can result in overly optimistic performance metrics.
By focusing on these practices, you can enhance the reliability of your backtesting outcomes, providing a solid foundation for refining your trading strategies.
Getting Started with Your First Strategy Test in TradingView Strategy Tester
Step-by-Step Guide to Setting Up a Strategy Test
1. Creating Your Pine Script
Open TradingView and go to the Pine Script editor. Start by writing a basic script. For example, a moving average crossover strategy: pine //@version=4 strategy(“Moving Average Cross”, overlay=true) shortMa = sma(close, 10) longMa = sma(close, 30) if (crossover(shortMa, longMa)) strategy.entry(“Buy”, strategy.long) if (crossunder(shortMa, longMa)) strategy.close(“Buy”) plot(shortMa, color=color.blue) plot(longMa, color=color.red)
2. Applying the Strategy
Save your script and add it to the chart. This will apply your strategy to the selected asset and timeframe.
3. Configuring Backtesting Parameters
In the Strategy Tester panel, set the date range for your backtest. Ensure you have a comprehensive historical dataset for accurate results.
4. Running the Test
Click “Add to Chart” to run the test. The Strategy Tester will simulate trades based on your script and historical data.
Interpreting Results from the Strategy Tester
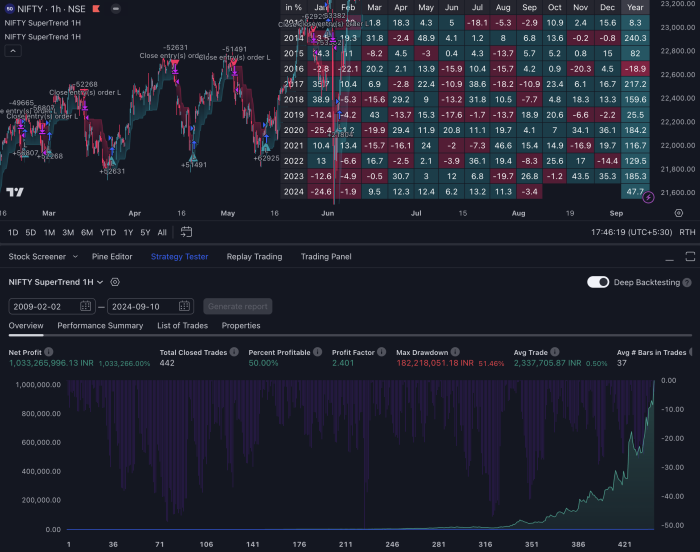
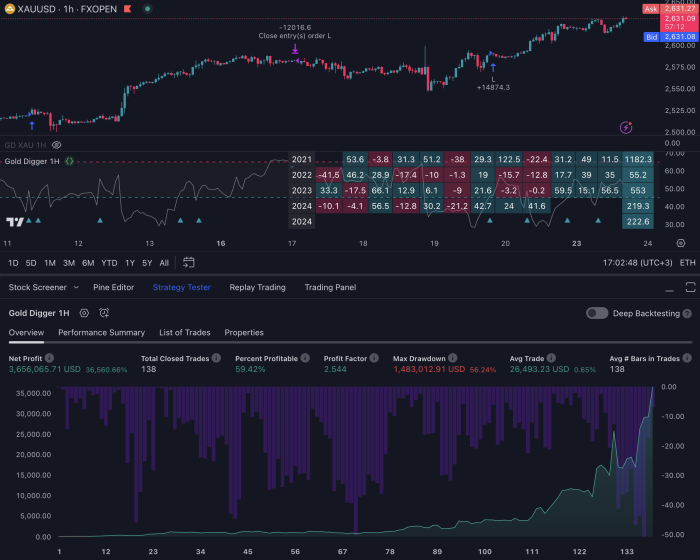
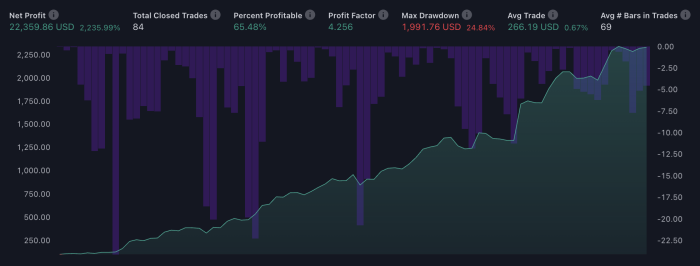
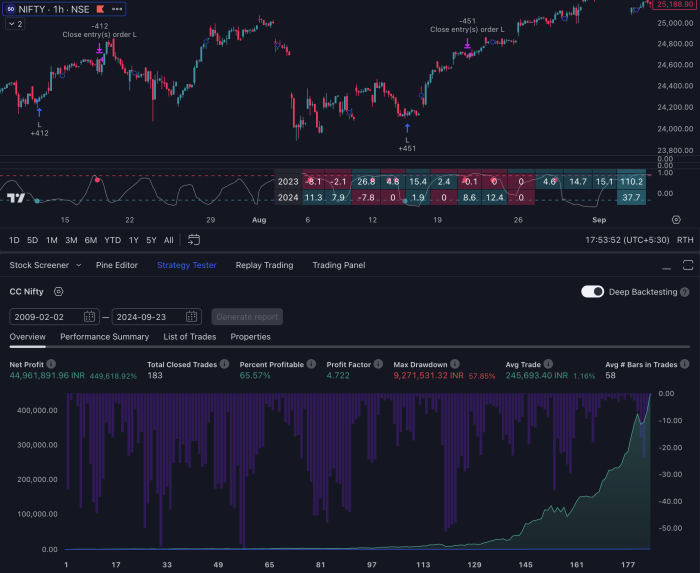
- Overview Tab: Displays key performance metrics such as net profit, max drawdown, and total number of trades.
- Performance Summary: Breaks down individual trades with details like entry/exit points, profit/loss per trade, and win rate.
- List of Trades: Provides a chronological list of all trades executed during the backtest.
Making Informed Adjustments Based on Performance Metrics
Analyzing Key Metrics:
- Win Rate: Indicates the percentage of profitable trades. A higher win rate generally means more consistent returns.
- Drawdown: Measures peak-to-trough decline during your backtest period. Lower drawdown suggests better risk management.
- Profit Factor: Ratio of gross profits to gross losses. A profit factor above 1 indicates profitability.
Adjusting Your Strategy:
- If your win rate is low or drawdown is high, consider tweaking your entry/exit conditions or adding filters.
- Optimize parameters such as moving average periods or stop-loss levels based on observed performance.
By carefully analyzing these metrics and adjusting your strategy accordingly, you can enhance its effectiveness before deploying it in live markets.
Conclusion
Use the TradingView Strategy Tester as a powerful tool for refining your trading strategies. This feature-rich platform offers invaluable insights through backtesting, forward testing, and performance analysis. By leveraging historical data and real-time market conditions, you can optimize your strategies before deploying them in live markets.
Key benefits include:
- Risk Management: Implement effective rules to manage risk and trigger actions under specific conditions.
- Order Execution Simulation: Emulate order fills accurately to understand potential outcomes.
- Customization: Tailor testing scenarios to fit diverse trading symbols and timeframes.
The future prospects of the TradingView Strategy Tester highlight its role in enhancing trading technology. As markets evolve, staying ahead with refined strategies will be crucial. Use this tool to gain a competitive edge and ensure your trading tactics are robust and adaptive.
FAQs (Frequently Asked Questions)
What is the TradingView Strategy Tester?
The TradingView Strategy Tester is a powerful tool designed for traders to evaluate and optimize their trading strategies. It integrates with Pine Script, allowing users to backtest their strategies using historical data and analyze performance metrics.
How do I set up my first strategy test in TradingView?
To set up your first strategy test in TradingView, you need to create a script using Pine Script. Once your script is ready, you can run the strategy test by selecting the appropriate settings and analyzing the results based on performance metrics such as win rate and drawdown.
What are the key features of the TradingView Strategy Tester?
Key features of the TradingView Strategy Tester include backtesting with historical data, forward testing for real-time performance observation, detailed performance analysis reports, order execution simulation, and risk management tools to help traders manage their risk effectively.
What is the difference between backtesting and forward testing?
Backtesting involves evaluating a trading strategy using historical data to see how it would have performed in the past. In contrast, forward testing refers to applying the strategy in real-time market conditions to observe its performance live. Both methods provide valuable insights but serve different purposes.
What are some common pitfalls to avoid during backtesting?
Common pitfalls during backtesting include overfitting your strategy to historical data, neglecting transaction costs, and failing to ensure the integrity of historical data used for testing. Awareness of these issues is crucial for obtaining reliable results.
How can I interpret results from the Strategy Tester?
Interpreting results from the Strategy Tester involves analyzing various performance metrics such as win rate, drawdown, and trade summaries. By focusing on these metrics, traders can make informed adjustments to their strategies for better future performance.

