


Financial markets operate according to fundamental principles that traders and investors must understand to make informed decisions. Market movements are driven by multiple factors, including economic indicators, investor sentiment, and geopolitical developments. Economic indicators serve as key market drivers.
Gross Domestic Product (GDP) growth rates, unemployment statistics, and inflation data directly influence market direction. Positive GDP reports typically generate upward price momentum, while increasing unemployment rates often produce downward pressure on asset prices. Market psychology plays a significant role in price formation.
Investors frequently make decisions based on emotional responses rather than analytical evaluation of market conditions. This behavioral pattern creates volatility and can produce unexpected price fluctuations. During periods of uncertainty, such as financial crises or political instability, fear-driven selling often results in rapid asset price declines.
Recognition of these psychological factors enables market participants to better predict potential price movements and adjust their positions accordingly.
Key Takeaways
- Grasp market dynamics and create a clear trading plan.
- Apply risk management and use technical and fundamental analysis.
- Diversify investments and employ stop loss orders to protect capital.
- Time trades wisely and keep track of market trends and global news.
- Regularly review and adapt your trading strategy for better results.
Developing a Solid Trading Plan
A well-structured trading plan serves as a roadmap for traders, guiding their decisions and actions in the market. This plan should encompass various elements, including entry and exit strategies, risk tolerance, and specific goals. For instance, a trader might decide to enter a position when a stock reaches a certain price point or when technical indicators signal a buying opportunity.
Establishing clear criteria for entering and exiting trades helps eliminate emotional decision-making and fosters discipline. Additionally, a solid trading plan should incorporate a review process to assess performance regularly. By analyzing past trades, traders can identify patterns in their decision-making and refine their strategies over time.
This iterative approach not only enhances trading skills but also builds confidence in one’s ability to navigate the market effectively. A trader who meticulously documents their trades and outcomes can learn from both successes and failures, ultimately leading to improved performance.
Implementing Risk Management Strategies
Risk management is a cornerstone of successful trading and investing. Without effective risk management strategies in place, even the most promising trades can lead to significant losses. One common approach is to determine the maximum amount of capital one is willing to risk on a single trade, often expressed as a percentage of the total trading account.
For example, many traders adhere to the rule of risking no more than 1-2% of their account on any given trade. This practice helps preserve capital and allows for continued participation in the market even after experiencing losses. Another essential aspect of risk management is diversification.
By spreading investments across various asset classes or sectors, traders can mitigate the impact of adverse movements in any single investment.
Additionally, employing tools such as stop-loss orders can further protect against significant downturns by automatically selling an asset when it reaches a predetermined price.
Utilizing Technical Analysis Tools
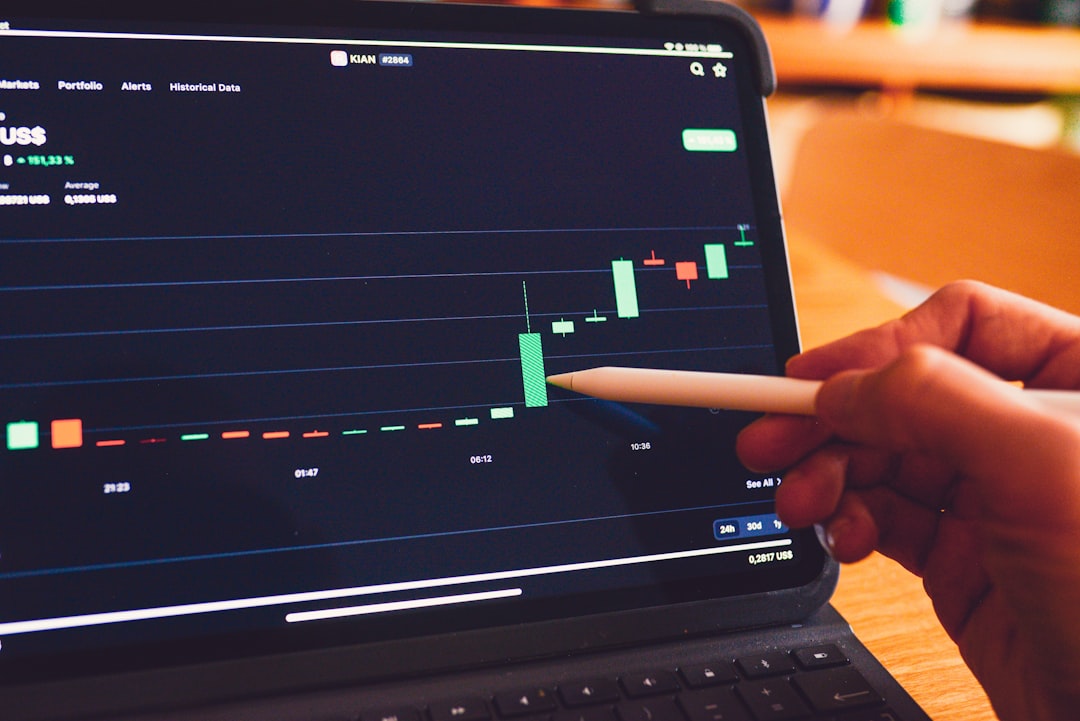
Technical analysis is a method used by traders to evaluate securities by analyzing statistics generated by market activity, such as past prices and volume. This approach relies heavily on charts and various indicators to identify trends and potential reversal points. For example, moving averages are commonly used to smooth out price data and identify the direction of the trend.
A trader might use a 50-day moving average to determine whether a stock is in an uptrend or downtrend; if the price is consistently above this average, it may indicate bullish momentum. In addition to moving averages, other technical indicators such as Relative Strength Index (RSI) and Bollinger Bands can provide valuable insights into market conditions. The RSI measures the speed and change of price movements and can indicate overbought or oversold conditions.
Conversely, Bollinger Bands help traders assess volatility by plotting standard deviations above and below a moving average. By combining these tools, traders can develop a comprehensive view of market dynamics and make more informed trading decisions.
Leveraging Fundamental Analysis
| Strategy Name | Time Period | Win Rate (%) | Average Return per Trade (%) | Max Drawdown (%) | Sharpe Ratio | Number of Trades |
|---|---|---|---|---|---|---|
| Momentum Breakout | Jan 2023 – Dec 2023 | 62 | 1.8 | 8.5 | 1.25 | 150 |
| Mean Reversion | Jan 2023 – Dec 2023 | 58 | 1.5 | 7.2 | 1.10 | 130 |
| Trend Following | Jan 2023 – Dec 2023 | 65 | 2.1 | 10.0 | 1.40 | 120 |
| Scalping | Jan 2023 – Dec 2023 | 70 | 0.8 | 5.0 | 1.05 | 300 |
| Pairs Trading | Jan 2023 – Dec 2023 | 60 | 1.3 | 6.8 | 1.15 | 110 |
While technical analysis focuses on price movements and patterns, fundamental analysis delves into the underlying factors that drive an asset’s value. This approach involves evaluating a company’s financial health through its earnings reports, balance sheets, and cash flow statements. For instance, a trader analyzing a technology company might look at its revenue growth, profit margins, and research and development expenditures to gauge its future potential.
Strong fundamentals often correlate with long-term price appreciation. Moreover, macroeconomic factors play a significant role in fundamental analysis. Interest rates, inflation rates, and overall economic growth can influence market sentiment and asset valuations.
For example, when central banks lower interest rates to stimulate economic growth, it can lead to increased borrowing and spending by consumers and businesses alike. This environment often benefits equities as companies experience higher demand for their products and services. By integrating fundamental analysis into their trading strategies, investors can make more informed decisions based on the intrinsic value of assets rather than solely relying on price movements.
Diversifying Your Portfolio
Diversification is a critical strategy for managing risk in investment portfolios. By allocating capital across various asset classes—such as stocks, bonds, real estate, and commodities—investors can reduce the impact of poor performance in any single investment on their overall portfolio. For instance, during periods of economic downturns when equities may struggle, bonds often provide stability and income generation.
This balance helps investors weather market fluctuations more effectively. Furthermore, diversification can also extend beyond asset classes to include geographic regions and sectors. An investor who holds international stocks alongside domestic equities may benefit from exposure to different economic cycles and growth opportunities worldwide.
For example, emerging markets may offer higher growth potential compared to developed markets but come with increased volatility. By diversifying across various regions and sectors, investors can create a more resilient portfolio that aligns with their risk tolerance and investment objectives.
Using Stop Loss Orders
Stop-loss orders are essential tools for managing risk in trading by automatically selling an asset when it reaches a specified price level. This mechanism helps traders limit potential losses without requiring constant monitoring of their positions. For instance, if a trader purchases shares of a stock at $50 and sets a stop-loss order at $45, the shares will automatically be sold if the price falls to that level.
This approach allows traders to maintain discipline by adhering to their predetermined risk parameters. In addition to protecting against losses, stop-loss orders can also be used strategically to lock in profits as prices rise. A trailing stop-loss order adjusts automatically with the asset’s price movement; for example, if a stock rises to $60 with a trailing stop set at $5 below the highest price reached, the stop-loss would move up to $55.
This strategy enables traders to capitalize on upward momentum while safeguarding against sudden reversals.
Timing Your Trades
Timing is crucial in trading; entering or exiting positions at the right moment can significantly impact profitability. Traders often employ various strategies to determine optimal entry and exit points based on market conditions and technical indicators. For instance, some traders may use breakout strategies that involve entering positions when an asset surpasses established resistance levels or breaks below support levels.
These breakouts often signal strong momentum that can lead to substantial price movements. Conversely, timing exits is equally important for maximizing gains or minimizing losses. Traders may utilize profit targets based on technical analysis or set exit points based on changes in market sentiment or news events.
For example, if a trader anticipates that a stock will face resistance at a certain price level due to historical trends or upcoming earnings reports, they may choose to exit their position before reaching that point to secure profits.
Monitoring Market Trends
Staying attuned to market trends is vital for making informed trading decisions. Trends can be identified through various methods, including technical analysis tools like trend lines or moving averages that help visualize price movements over time. Recognizing whether an asset is in an uptrend or downtrend allows traders to align their strategies accordingly—buying in uptrends while considering short positions in downtrends.
Additionally, monitoring broader market trends can provide context for individual asset performance. Economic indicators such as consumer confidence indices or manufacturing data can signal shifts in market sentiment that may affect multiple sectors simultaneously. For instance, if consumer confidence rises significantly, it may indicate increased spending potential across various industries—prompting traders to consider long positions in consumer discretionary stocks.
Staying Informed About Global Events
Global events have far-reaching implications for financial markets; thus, staying informed about geopolitical developments is essential for traders and investors alike.
For example, during the COVID-19 pandemic, markets experienced unprecedented fluctuations as investors reacted to news regarding vaccine developments and government stimulus measures.
Furthermore, central bank policies play a crucial role in shaping market dynamics globally. Decisions made by institutions like the Federal Reserve or the European Central Bank regarding interest rates or quantitative easing can have ripple effects across various asset classes worldwide. Traders who remain vigilant about these developments are better positioned to anticipate potential market movements driven by macroeconomic factors.
Evaluating and Adjusting Your Strategy
The financial markets are dynamic environments that require continuous evaluation and adjustment of trading strategies. Regularly assessing performance metrics—such as win/loss ratios or average returns—can provide valuable insights into what works and what doesn’t within one’s trading approach. For instance, if a trader notices that certain strategies yield consistent losses during specific market conditions (e.g., high volatility), they may choose to modify their approach accordingly.
Moreover, adapting strategies based on changing market conditions is crucial for long-term success. What may have worked well during one phase of the market cycle might not be effective during another phase characterized by different dynamics or investor sentiment shifts. By remaining flexible and open-minded about strategy adjustments—whether it involves altering risk management techniques or incorporating new analytical tools—traders can enhance their resilience in navigating ever-evolving market landscapes.
In conclusion, mastering the art of trading requires a multifaceted approach that encompasses understanding market dynamics, developing robust plans, implementing risk management strategies, utilizing both technical and fundamental analysis tools, diversifying portfolios effectively, employing stop-loss orders judiciously while timing trades accurately—all while staying informed about global events impacting financial markets—and continuously evaluating performance for necessary adjustments along the way.
For those interested in enhancing their trading strategies, a valuable resource is the article on TradingView Backtesting Strategies. This article delves into the importance of backtesting in professional trading, providing insights on how to effectively evaluate the performance of various trading strategies. By understanding the results of backtesting, traders can make more informed decisions and refine their approaches to maximize profitability.
FAQs
What is a professional trading strategy?
A professional trading strategy is a well-defined plan used by experienced traders to make informed decisions in financial markets. It typically includes specific rules for entry, exit, risk management, and position sizing.
How are the results of a professional trading strategy measured?
Results are commonly measured using metrics such as return on investment (ROI), win rate, risk-reward ratio, drawdown, and overall profitability over a specified period.
Can professional trading strategies guarantee profits?
No trading strategy can guarantee profits. While professional strategies aim to increase the probability of success, all trading involves risk, and losses are possible.
What types of markets can professional trading strategies be applied to?
Professional trading strategies can be applied to various markets, including stocks, forex, commodities, futures, and cryptocurrencies.
How important is risk management in professional trading strategies?
Risk management is crucial in professional trading strategies. It helps protect capital by limiting losses and managing exposure to market volatility.
Are professional trading strategy results consistent over time?
Results can vary due to changing market conditions. Consistency depends on the strategy’s adaptability, discipline in execution, and ongoing evaluation.
What tools are commonly used to analyze professional trading strategy results?
Traders often use software for backtesting, performance analytics, charting platforms, and statistical tools to evaluate strategy effectiveness.
Is backtesting necessary for professional trading strategies?
Yes, backtesting is essential as it allows traders to test their strategies on historical data to assess potential performance before applying them in live markets.
Can beginners use professional trading strategies?
While beginners can learn from professional strategies, they should first understand the underlying principles and practice with simulated trading to manage risk effectively.
How often should professional trading strategies be reviewed?
Strategies should be reviewed regularly, often monthly or quarterly, to ensure they remain effective under current market conditions and to make necessary adjustments.
