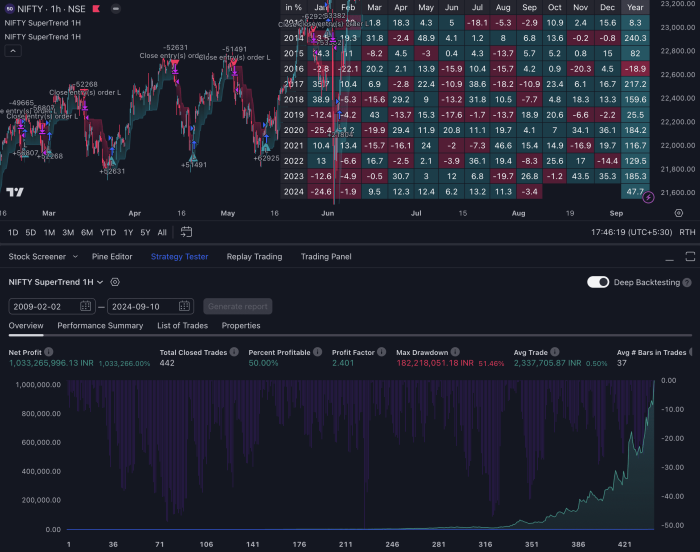
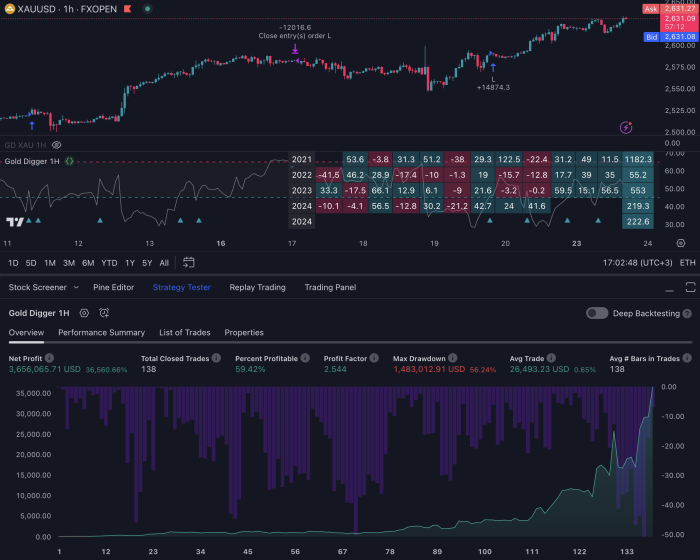
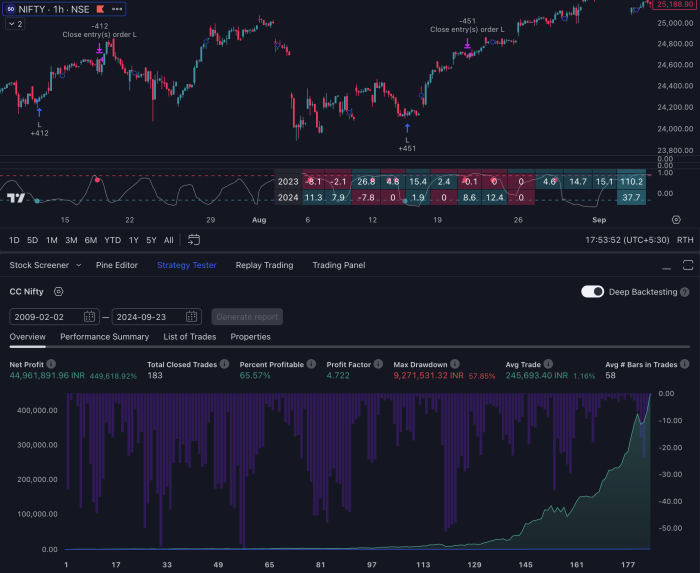
Day trading is a fast-paced trading strategy that involves buying and selling financial instruments within the same trading day. To navigate this dynamic environment successfully, traders rely heavily on technical indicators. These indicators are mathematical calculations based on price, volume, or open interest of a security, and they help traders make informed decisions by providing insights into market trends, momentum, and potential reversals.
Understanding these indicators is crucial for any day trader aiming to enhance their trading performance. Technical indicators can be broadly categorized into trend-following indicators, momentum indicators, volatility indicators, and volume indicators. Trend-following indicators, such as moving averages, help traders identify the direction of the market.
Momentum indicators, like the Relative Strength Index (RSI), measure the speed and change of price movements. Volatility indicators, such as Bollinger Bands, assess market fluctuations and potential price ranges. Lastly, volume indicators provide insights into the strength of price movements by analyzing trading volume.
By understanding these categories and their applications, traders can better equip themselves to make strategic decisions in the fast-moving world of day trading.
Key Takeaways
- Day trading indicators are tools used to analyze market data and make informed trading decisions.
- Choosing the right indicators for your strategy is crucial for successful day trading.
- Moving averages can be utilized to identify trends and potential entry and exit points for profitable trades.
- The Relative Strength Index (RSI) is a valuable tool for identifying overbought and oversold conditions in the market.
- Bollinger Bands can be incorporated into trading strategies to identify volatility-based trading signals.
Choosing the Right Indicators for Your Strategy
Aligning Indicators with Trading Goals
For instance, a trader focused on short-term price movements may prioritize momentum indicators to capture quick gains, while another trader looking for longer-term trends might favor trend-following indicators.
Considering Market Characteristics
It is essential to consider how different indicators complement each other and contribute to a cohesive trading strategy. Moreover, traders should also take into account the asset class they are trading. Different markets exhibit unique characteristics; for example, forex markets may require different indicators compared to stock markets due to varying volatility and liquidity profiles.
Adapting to Market Conditions
Market conditions can influence indicator effectiveness. In a trending market, trend-following indicators may yield better results, while in a sideways market, oscillators like RSI or Stochastic Oscillator may provide more reliable signals. Therefore, understanding both personal trading style and market dynamics is vital when choosing the right indicators.
Utilizing Moving Averages for Profitable Trades
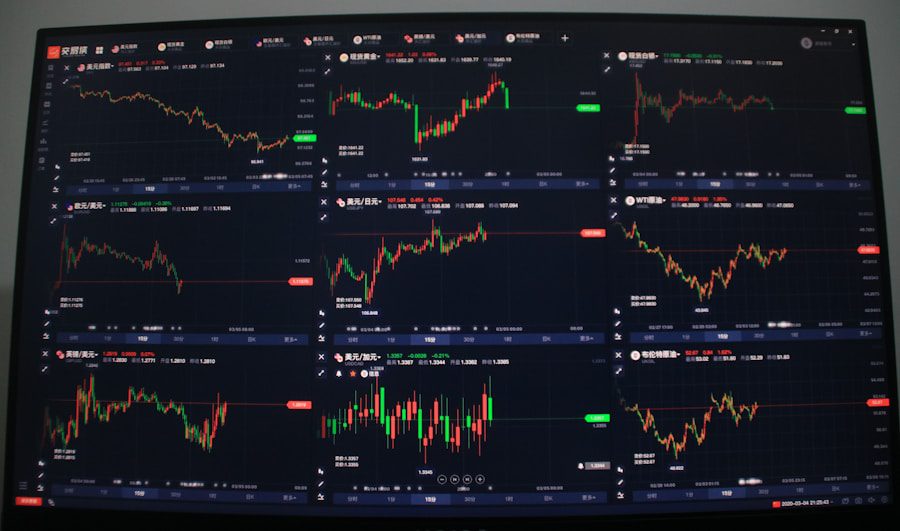
Moving averages are among the most widely used technical indicators in day trading due to their simplicity and effectiveness in identifying trends. A moving average smooths out price data by creating a constantly updated average price over a specified period. The two most common types are the simple moving average (SMA) and the exponential moving average (EMA).
The SMA calculates the average price over a set number of periods, while the EMA gives more weight to recent prices, making it more responsive to new information. Traders often use moving averages in conjunction with other indicators to confirm trends and generate buy or sell signals. For example, a common strategy involves using two moving averages of different lengths—a short-term EMA and a long-term SMA.
When the short-term EMA crosses above the long-term SMA, it generates a bullish signal indicating potential upward momentum. Conversely, when the short-term EMA crosses below the long-term SMA, it signals a bearish trend. This crossover strategy can be particularly effective in capturing significant price movements while minimizing false signals.
Using Relative Strength Index (RSI) to Identify Overbought and Oversold Conditions
| Date | Stock | RSI | Overbought/Oversold |
|---|---|---|---|
| 01/01/2022 | AAPL | 70 | Overbought |
| 01/01/2022 | GOOGL | 30 | Oversold |
| 01/02/2022 | MSFT | 65 | Overbought |
| 01/02/2022 | AMZN | 35 | Oversold |
The Relative Strength Index (RSI) is a momentum oscillator that measures the speed and change of price movements on a scale from 0 to 100. It is primarily used to identify overbought or oversold conditions in a market, which can indicate potential reversal points. An RSI reading above 70 typically suggests that an asset is overbought, while a reading below 30 indicates that it is oversold.
These thresholds can serve as valuable signals for traders looking to enter or exit positions. In practice, traders often look for divergences between RSI and price action as additional confirmation of potential reversals. For instance, if the price of an asset is making new highs while the RSI is failing to reach new highs, this divergence may suggest weakening momentum and a possible reversal.
Conversely, if the price is making new lows but the RSI is not confirming these lows, it could indicate that selling pressure is waning. By incorporating RSI into their trading strategies, traders can enhance their ability to identify key turning points in the market.
Incorporating Bollinger Bands for Volatility-based Trading Signals
Bollinger Bands are a volatility indicator that consists of three lines: a simple moving average (SMA) in the middle and two standard deviation lines above and below it. The distance between these bands varies based on market volatility; when volatility increases, the bands widen, and when it decreases, they contract. This dynamic nature makes Bollinger Bands particularly useful for identifying potential breakouts or reversals.
Traders often use Bollinger Bands in conjunction with other indicators to confirm signals. For example, when the price touches the upper band while accompanied by high volume, it may indicate an overbought condition and a potential reversal point. Conversely, if the price approaches the lower band with increasing volume, it could signal an oversold condition and a possible buying opportunity.
Additionally, traders may look for “squeezes,” where the bands contract significantly, indicating low volatility and potential for a breakout in either direction. By understanding how to interpret Bollinger Bands effectively, traders can capitalize on volatility-driven opportunities.
Harnessing the Power of MACD (Moving Average Convergence Divergence) for Trend Identification

Understanding MACD Crossovers
Traders often use MACD crossovers as signals for potential trades. When the MACD line crosses above the signal line, it generates a bullish signal indicating upward momentum; conversely, when it crosses below, it signals bearish momentum.
Identifying Divergences
Additionally, traders look for divergences between MACD and price action as confirmation of potential trend reversals. For instance, if prices are making new highs while MACD fails to do so, this divergence may suggest weakening momentum and an impending reversal.
Integrating MACD into Trading Strategies
By incorporating MACD into their trading strategies, traders can gain valuable insights into market trends and potential entry or exit points.
Implementing Fibonacci Retracement Levels for Price Targeting
Fibonacci retracement levels are based on the Fibonacci sequence—a mathematical series where each number is the sum of the two preceding ones—and are widely used in technical analysis to identify potential support and resistance levels during price corrections. Traders use these levels by plotting horizontal lines at key Fibonacci percentages—typically 23.6%, 38.2%, 50%, 61.8%, and 100%—on a price chart after a significant price movement.
When prices retrace after a strong trend, these Fibonacci levels can serve as potential reversal points where traders might look to enter positions in anticipation of a continuation of the original trend.
For example, if an asset has experienced a strong upward movement followed by a pullback that reaches the 61.8% Fibonacci level, traders may consider this level as an opportunity to buy in anticipation of further upward movement. Additionally, combining Fibonacci retracement levels with other indicators can enhance their effectiveness; for instance, if a Fibonacci level coincides with a moving average or support level identified through other means, it may provide stronger confirmation for potential trades.
Combining Multiple Indicators for Confirmation and Increased Profit Potential
One of the most effective strategies in day trading is combining multiple technical indicators to create a comprehensive trading system that enhances decision-making and reduces false signals. Relying on a single indicator can lead to misleading conclusions; however, using multiple indicators allows traders to confirm signals across different dimensions—trend direction, momentum strength, volatility conditions—thereby increasing confidence in their trades. For instance, a trader might use moving averages to identify overall trend direction while employing RSI to gauge momentum strength and Bollinger Bands to assess volatility conditions.
If all three indicators align—indicating an uptrend with strong momentum and favorable volatility conditions—the trader may feel more confident entering a long position.
Conversely, if there are conflicting signals from different indicators—such as an uptrend indicated by moving averages but an overbought condition suggested by RSI—it may prompt caution or even lead to avoiding trades altogether. By integrating multiple indicators into their trading strategies, day traders can create robust systems that adapt to changing market conditions while maximizing profit potential through well-informed decision-making processes.
This multifaceted approach not only enhances accuracy but also fosters greater discipline in executing trades based on comprehensive analysis rather than impulsive reactions to isolated signals.
If you are interested in learning more about automation in day trading, you should check out the article on pineindicators.com. This article discusses how automation can be used to streamline the trading process and improve efficiency. Additionally, if you want to delve into using MACD Pine Script strategy in your day trading, you can find a helpful guide on pineindicators.com. Lastly, for those looking to incorporate Pine Script for algorithmic trading, there is a comprehensive article available on pineindicators.com. These resources can provide valuable insights and strategies for enhancing your day trading experience.
FAQs
What are day trading indicators?
Day trading indicators are tools used by traders to analyze the market and make informed decisions about buying and selling financial instruments within the same trading day. These indicators can help traders identify trends, momentum, volatility, and potential entry and exit points.
What are some common day trading indicators?
Some common day trading indicators include moving averages, relative strength index (RSI), stochastic oscillator, Bollinger Bands, and volume indicators. These indicators can be used individually or in combination to analyze market conditions and make trading decisions.
How do day trading indicators work?
Day trading indicators work by using mathematical calculations and historical price data to provide insights into market trends and potential price movements. Traders use these indicators to identify patterns and signals that can help them make profitable trading decisions.
Are day trading indicators reliable?
The reliability of day trading indicators depends on various factors, including market conditions, the specific indicator used, and the trader’s skill in interpreting the signals. While indicators can provide valuable insights, they are not foolproof and should be used in conjunction with other forms of analysis and risk management strategies.
Can day trading indicators guarantee profits?
No, day trading indicators cannot guarantee profits. Trading in financial markets always carries a level of risk, and no indicator can predict market movements with 100% accuracy. Traders should use indicators as part of a comprehensive trading strategy and be aware of the potential risks involved in day trading.

