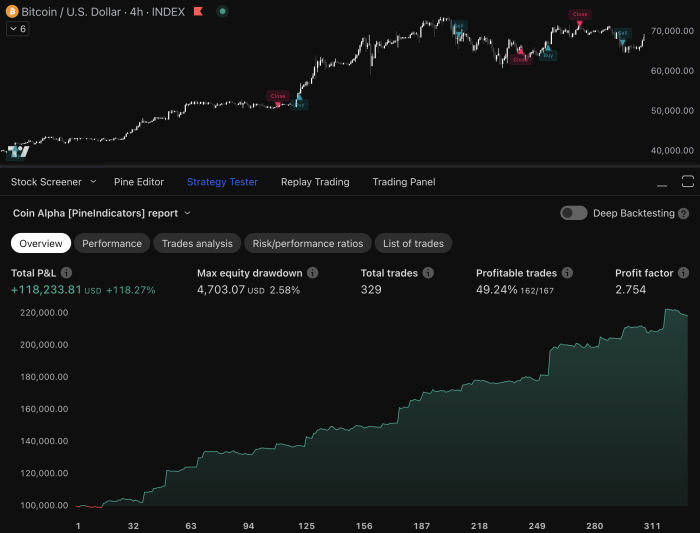
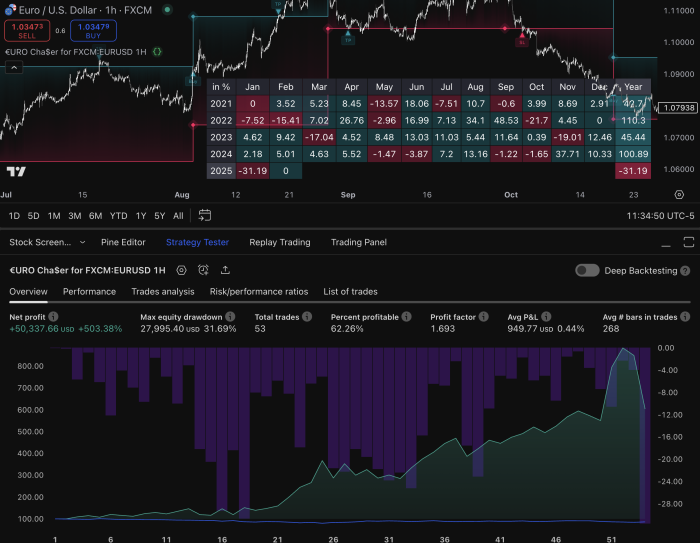
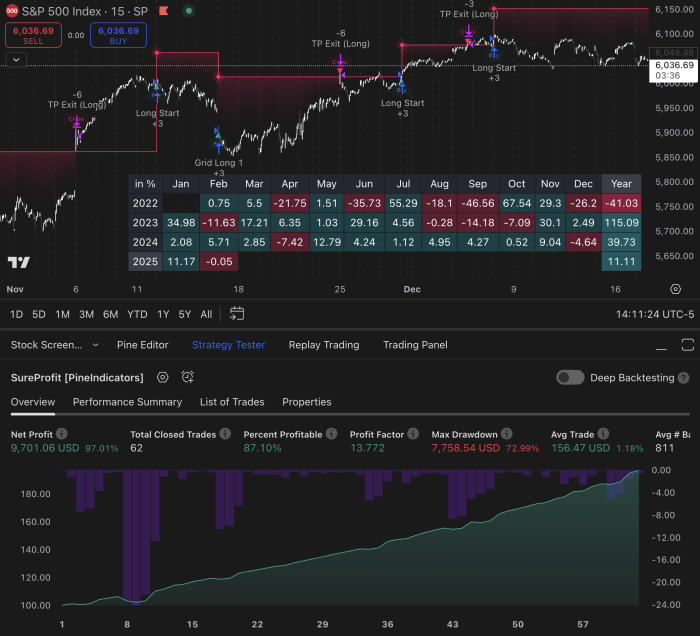
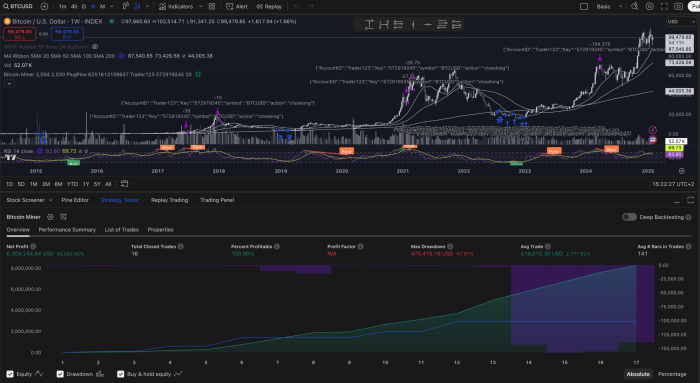
Trading success relies heavily on your ability to interpret market data effectively. Pine Script indicators have changed the game for traders using the TradingView platform, making it easier than ever to analyze markets. These custom-built tools, created with TradingView’s unique programming language, give traders the power to make informed decisions based on data.
Pine Script indicators serve multiple functions in your trading journey:
- Identify market trends and potential reversals
- Measure momentum and volatility
- Spot overbought and oversold conditions
- Generate entry and exit signals
- Analyze multiple timeframes simultaneously
The beauty of Pine Script lies in its flexibility – you can customize existing indicators or create new ones to match your trading style. As markets evolve in 2025, having the right technical analysis tools becomes crucial for staying competitive.
This guide explores the top 10 Pine Script indicators that are changing the way traders analyze market data. You’ll discover how each indicator works, their practical applications, and ways to incorporate them into your trading strategy for improved results. For instance, mastering TradingView breakout strategies can significantly enhance your ability to identify market trends and potential reversals. Similarly, understanding TradingView automation for consistent trades can streamline your trading process, making it more efficient.
Moreover, exploring TradingView stock strategies can provide valuable insights into stock market trading, while utilizing the automated Pine crypto service can simplify your cryptocurrency trading experience.
1. CM_Ultimate RSI Multi Time Frame by ChrisMoody
The CM_Ultimate RSI Multi Time Frame indicator is an advanced tool for technical analysis that takes the traditional Relative Strength Index (RSI) and enhances it by making it applicable across multiple timeframes. This powerful indicator examines market data on different time scales, giving traders a holistic understanding of price momentum and trend strength.
Key Features:
- Simultaneous analysis of 3 different timeframes
- Color-coded signals for easy trend identification
- Built-in divergence detection system
- Customizable overbought/oversold levels
- Advanced filtering to reduce false signals
The indicator excels at identifying high-probability trade setups through its unique multi-timeframe approach. When all timeframes align, traders receive strong confirmation signals that can lead to more accurate entries and exits.
Real Trading Applications:
- A crypto trader using CM_Ultimate RSI from an automated crypto signal platform spotted a bullish divergence on Bitcoin in January 2025, entering at $42,000 before a rally to $52,000
- Stock traders leveraged the indicator’s multi-timeframe analysis to identify the bottom of the tech sector correction in March 2025
- Forex traders use the color-coded signals to catch trend reversals in major currency pairs
The indicator’s strength lies in its ability to filter out market noise by requiring confirmation across different time periods. This systematic approach helps traders avoid false signals and identify genuine trading opportunities with higher probability success rates. For those looking to enhance their trading skills further, resources such as a Pine Script course on TradingView could provide valuable insights.
2. Death Cross – 200 MA / 50 Cross Checker by MexPayne
The Death Cross – 200 MA / 50 Cross Checker indicator is a powerful tool for identifying potential market downturns. This technical analysis indicator tracks the relationship between two critical moving averages: the 50-day and 200-day MA.
Key Components:
- 50-day Moving Average (faster-moving line)
- 200-day Moving Average (slower-moving line)
- Cross detection algorithm
- Visual alerts for bearish signals
A “Death Cross” forms when the 50-day MA crosses below the 200-day MA, signaling a potential shift from bullish to bearish market conditions. This crossing pattern has historically preceded significant market declines.
Implementation Guide:
- Add the indicator to your chart
- Set alert notifications for crossover events
- Watch for price action confirmation
- Monitor volume for validation
- Check multiple timeframes for confluence
The indicator’s strength lies in its ability to filter out market noise by focusing on longer-term trends. Traders often combine Death Cross signals with other technical indicators to build a comprehensive trading strategy.
For those looking to enhance their trading strategies further, exploring custom scripts through TradingView’s Pine Script can be beneficial. These custom scripts allow traders to create tailored indicators that suit their specific needs and preferences.
Practical Application:
- Use during trending markets
- Apply to any liquid asset class
- Set price alerts at -2% below the cross
- Consider market context and sector trends
- Factor in volatility conditions
The Death Cross indicator excels at identifying major trend changes, particularly in established markets with consistent trading volumes. Its reliability increases when combined with fundamental analysis and proper risk management strategies.
3. Gaps Indicator
Price gaps are significant market events where a security’s price jumps from one level to another without any trading happening in between. The Gaps Indicator in Pine Script helps you find these important market signals accurately.
Types of Price Gaps You Can Identify:
- Breakaway gaps – Signal the start of a new trend
- Runaway gaps – Appear during strong trends
- Exhaustion gaps – Indicate potential trend reversals
- Common gaps – Regular market fluctuations
You can learn more about these types of price gaps in this comprehensive guide on the 4 types of price gaps. The Gaps Indicator automatically highlights these patterns on your charts, making it easier to spot potential trading opportunities. You can customize the indicator to display different gap types with unique colors and alert settings.
Practical Tips for Trading with Gaps:
- Set price alerts for gap formations above specific thresholds using our tradingview alert setup for automated trading
- Look for volume confirmation alongside gaps
- Consider the market context and time frame
- Use gap fill probability to plan your trades
- Combine with other technical indicators like our Versatile Bollinger Band Cascade for validation
The indicator’s built-in filtering system helps eliminate false signals by focusing on significant gaps that meet your specified criteria. You can adjust parameters like minimum gap size and time frame to match your trading strategy.
Many traders use the Gaps Indicator to identify potential support and resistance levels, as gaps often act as psychological price barriers. The indicator’s ability to measure gap size and duration provides valuable insights for position sizing and risk management.
4. WaveTrend Oscillator (WT) by LazyBear
The WaveTrend Oscillator (WT) stands out as a powerful momentum indicator created by LazyBear. This sophisticated tool combines the principles of moving averages and channels to generate accurate trading signals.
Key Features:
- Two primary signal lines: Wave A (fast) and Wave B (slow)
- Built-in overbought/oversold zones
- Color-coded signals for easy trend identification
- Cross-signal generation for potential entry/exit points
The WT indicator excels at identifying market conditions through specific zones:
- Overbought: Values above +60
- Oversold: Values below -60
- Neutral: Values between -60 and +60
Trading Strategies with WT:
- Cross Signals
- Buy when Wave A crosses above Wave B
- Sell when Wave A crosses below Wave B
- Confirm signals with price action patterns
- Divergence Trading
- Spot bullish divergence when price makes lower lows but WT makes higher lows
- Identify bearish divergence when price makes higher highs but WT makes lower highs
- Zone-Based Trading
- Enter long positions when WT exits oversold territory
- Take profits or short when WT reaches overbought levels
- Use multiple timeframe analysis for stronger confirmation
- Application in Various Market Conditions
The WaveTrend Oscillator performs exceptionally well in trending markets, helping traders identify potential reversals before they occur. However, it can also be effectively used in sideways markets, where strategies like range trading can yield consistent profits and manage risk effectively.
By combining WT signals with volume analysis and support/resistance levels, you can strengthen your trading decisions. Additionally, exploring Forex strategies, high-profit trading strategies, or even crypto scalping strategies on TradingView can further enhance your trading performance. Lastly, consider leveraging backtesting strategies to refine your approach and improve your overall results.
5. Moving Average Convergence Divergence (MACD)
The MACD is a powerful momentum indicator in Pine Script that helps traders understand price momentum by looking at the relationship between moving averages. It calculates the difference between two exponential moving averages (usually 12 and 26 periods) and shows it along with a signal line.
Key Components of MACD:
- MACD Line: (12-period EMA – 26-period EMA)
- Signal Line: 9-period EMA of MACD Line
- Histogram: MACD Line – Signal Line
Reading MACD Signals:
Bullish Signals
- MACD line crosses above signal line
- MACD line crosses above zero line
- Positive divergence between price and MACD
Bearish Signals
- MACD line crosses below signal line
- MACD line crosses below zero line
- Negative divergence between price and MACD
Practical Trading Tips:
- Use MACD crossovers in conjunction with price action
- Look for divergences during strong trends
- Combine with support/resistance levels for better entry points
- Watch histogram size changes for momentum shifts
The MACD is most effective in trending markets, where it can help you spot potential trend continuations and reversals. It’s especially useful for swing trading strategies because it measures both the direction of the trend and its momentum. You can adjust the settings of the indicator to fit your trading timeframe—longer periods are better for position trading while shorter periods work well for day trading.
To enhance your trading success even further, consider leveraging verified trading signals which can significantly boost your decision-making process. These verified trading signals cater to all experience levels and have been shown to improve overall trading success rates.
Additionally, when using platforms like TradingView, there are various trading signals available which can provide you with valuable insights. You could also explore options to buy verified trading signals, which could serve as a reliable resource in your trading journey.
6. Pi Cycle Bottom Indicator by Doncic
The Pi Cycle Bottom Indicator is a powerful tool in cryptocurrency trading, specifically designed to identify potential market bottoms with remarkable accuracy. Created by Doncic, this Pine Script indicator uses mathematical relationships between moving averages to spot optimal buying opportunities.
Key Features:
- Dual moving average system
- Pi-based mathematical calculations
- Visual alerts for potential bottom formations
- Customizable timeframe settings
The indicator’s effectiveness shines through its historical performance. During the 2021 crypto market crash, traders using the Pi Cycle Bottom Indicator successfully identified the bottom at $29,000 BTC/USD, leading to substantial gains as Bitcoin later rallied to $69,000.
Real Trading Success Stories:
- A trader accumulated ETH at $880 during the 2022 bottom signal
- Multiple successful entries in altcoin markets during Q3 2023
- Strategic positioning before the 2024 bull run
Practical Application:
- Watch for convergence between the short and long-term moving averages
- Confirm signals with volume analysis
- Set price alerts at key mathematical levels
- Use multiple timeframe analysis for stronger confirmation
The Pi Cycle Bottom Indicator excels in volatile crypto markets where traditional indicators often fail. Its unique approach to bottom detection combines mathematical precision with market psychology, providing traders with a reliable tool for timing their entries in cryptocurrency markets.
7. RCI3lines by gero
RCI3lines is a powerful trend analysis tool that uses the ranking correlation index to provide traders with precise market insights. This indicator, part of technical analysis, displays three distinct lines on your chart, each representing different time periods of price correlation.
Key Components of RCI3lines:
- Short-term line (green): Tracks rapid market movements
- Medium-term line (blue): Identifies intermediate trends
- Long-term line (red): Shows sustained market direction
The strength of this indicator lies in its ability to measure price correlation across multiple timeframes. When the lines cross or align in specific patterns, they signal potential trend changes or continuation.
Trading Signals:
- Bullish Signal: All three lines move above the zero line
- Bearish Signal: All three lines drop below the zero line
- Trend Confirmation: Lines maintain parallel movement in the same direction
To interpret RCI3lines effectively, watch for divergence between price action and the indicator lines. A price making higher highs while the RCI lines make lower highs often signals an impending reversal.
The indicator performs exceptionally well in ranging markets, helping traders identify potential breakout points. By combining RCI3lines with volume analysis, you can validate trading signals and reduce false positives in your strategy.
For optimal results, set the indicator parameters to match your trading timeframe – shorter periods for day trading and longer periods for swing trading positions. You can easily implement this indicator using platforms like TradingView, which offers robust technical analysis tools to enhance your trading strategy.
8. Stochastic RSI
The Stochastic RSI combines two powerful momentum indicators to create a highly sensitive trading tool. This hybrid indicator takes the traditional RSI values and applies the Stochastic formula, resulting in enhanced market momentum signals.
Key Benefits:
- Reduced false signals compared to standard RSI
- Earlier detection of potential reversals
- Clear overbought and oversold zones
- Enhanced momentum confirmation
The indicator generates values between 0 and 100, with readings above 80 signaling overbought conditions and below 20 indicating oversold conditions. These levels create natural entry and exit points for trades.
Practical Application Example:
A Bitcoin trader spots the Stochastic RSI dropping below 20 during a market dip. The indicator then crosses back above 20, signaling a potential bullish reversal. The trader opens a long position at $35,000. As the price climbs to $38,500, the Stochastic RSI approaches 80, suggesting an overbought condition. The trader closes the position for a $3,500 profit.
To determine optimal exit points in such scenarios, traders should consider the market signals carefully and implement strategies that minimize losses while maximizing profits.
Trading Strategy Tips:
- Wait for confirmation from price action before entering trades
- Use multiple timeframes to validate signals
- Combine with trend-following indicators for better accuracy
- Set stop-losses based on recent support/resistance levels
The Stochastic RSI excels at identifying potential price reversals in ranging markets, making it particularly valuable for cryptocurrency and forex traders who need to capture shorter-term price movements. To further enhance trading efficiency, utilizing buy/sell scripts for TradingView can be beneficial. These scripts allow traders to master technical analysis with indicators like SMA, RSI, and VWAP for smarter trading decisions.
9. TDI – Traders Dynamic Index [Goldminds] by JuanManuelOrtiz
The TDI indicator stands out as a powerful analytical tool that combines multiple technical elements into a single, comprehensive view. This advanced Pine Script indicator integrates RSI calculations with volatility bands and moving averages to provide clear market signals.
Key Components of TDI:
- Green line: Fast RSI moving average
- Red line: Slow RSI moving average
- Yellow line: RSI price line
- Blue bands: Market volatility bands
You can spot potential trade setups when the green line crosses above the red line, signaling a bullish momentum shift. The opposite crossing indicates bearish conditions. The yellow line’s position relative to the blue bands helps identify overbought and oversold conditions.
Effective TDI Trading Strategies:
- Enter long positions when the green line crosses above the red line and the yellow line moves above the middle of the volatility bands
- Exit trades when the lines cross in the opposite direction
- Use wider volatility bands during high-volatility periods to avoid false signals
- Combine with support/resistance levels for enhanced accuracy
The TDI excels at filtering out market noise through its volatility bands integration. You’ll find it particularly useful in ranging markets where traditional indicators might struggle to provide clear signals. The indicator’s ability to show market momentum, trend direction, and volatility makes it a valuable addition to your trading toolkit.
10. True Strength Index
The True Strength Index (TSI) is a powerful momentum indicator that helps you identify market trends with great accuracy. This double-smoothed oscillator calculates price changes across three time periods, providing deeper insights into market dynamics.
Key Features:
- Measures both trend strength and price momentum
- Generates clear buy/sell signals through centerline crossovers
- Shows bullish/bearish divergences for potential reversals
- Filters out market noise through double smoothing
Trading Strategies with TSI:
1. Centerline Trading
- Buy when TSI crosses above zero
- Sell when TSI crosses below zero
- Use larger timeframes for more reliable signals
2. Divergence Trading
- Spot bullish divergence when price makes lower lows but TSI makes higher lows
- Identify bearish divergence when price makes higher highs but TSI makes lower highs
Real-Time Application:
Signal Line Settings:
- First Period: 25
- Second Period: 13
- Signal Length: 7
You can enhance TSI effectiveness by combining it with volume analysis. High volume during TSI signals strengthens the probability of successful trades. The indicator works best in trending markets where you can capitalize on strong momentum moves.
Pro Tip: Adjust the TSI settings based on your trading timeframe – use longer periods for position trading and shorter periods for day trading. This customization helps you capture the most relevant price movements for your strategy.
Conclusion
Pine Script indicators are powerful tools for traders looking to improve their strategies in 2025. The ten indicators we’ve discussed have unique advantages:
- Advanced trend analysis capabilities
- Real-time market insights
- Customizable parameters for personalized trading
- Multi-timeframe perspectives
- Enhanced risk management features
These tools turn raw market data into actionable trading signals, giving you an advantage in today’s ever-changing markets. The combination of technical analysis and Pine Script’s flexibility creates opportunities for both beginner and experienced traders to refine their approach.
Ready to take your trading skills to the next level?
Start with one indicator from our list of the best TradingView indicators for 2024 that matches your trading style. Test it in a demo account, understand its signals, and gradually incorporate it into your strategy. Your journey to optimized trading starts with these powerful Pine Script indicators.
We also recommend checking out our collection of free Pine Script indicators and using our Pine strategy automation tools for a more efficient trading experience.
For those wanting to learn more about Pine Script, our guide on Pine Script trading strategies is a valuable resource. Additionally, understanding effective trading strategies on TradingView could greatly improve your trading success.
Take action now: Go to TradingView, add these indicators to your charts, and discover new possibilities in your trading journey.
FAQs (Frequently Asked Questions)
What are Pine Script indicators and how do they enhance trading strategies?
Pine Script indicators are custom technical analysis tools created using TradingView’s Pine Script language. They help traders analyze market data, identify trends, momentum, and potential trading opportunities, thereby enhancing decision-making and optimizing trading strategies.
How does the CM_Ultimate RSI Multi Time Frame indicator assist in trend analysis?
The CM_Ultimate RSI Multi Time Frame indicator provides insights into momentum across different time frames by combining RSI readings. This helps traders better understand trend strength and make profitable decisions by spotting momentum shifts early.
What is the significance of the Death Cross – 200 MA / 50 Cross Checker in technical analysis?
The Death Cross – 200 MA / 50 Cross Checker identifies bearish signals when the 50-day moving average crosses below the 200-day moving average. This indicator is crucial for spotting potential downtrends, allowing traders to adjust their strategies accordingly.
How can the Gaps Indicator be used to identify trading opportunities?
The Gaps Indicator highlights price gaps on charts, which often signal strong market moves or reversals. Recognizing these gaps enables traders to capitalize on breakout or gap-fill opportunities, improving trade timing and profitability.
What advantages does combining Stochastic oscillator with RSI provide in market momentum analysis?
Combining Stochastic oscillator with RSI, as seen in the Stochastic RSI indicator, enhances market momentum signals by capturing overbought and oversold conditions more accurately. This combination improves identification of profitable entry and exit points in trading.
How effective is the Pi Cycle Bottom Indicator in cryptocurrency market bottom prediction?
The Pi Cycle Bottom Indicator has proven effective in predicting potential market bottoms in cryptocurrency trading. By analyzing specific moving average crossovers, it helps traders identify buying opportunities near significant price lows, supported by successful case studies.

