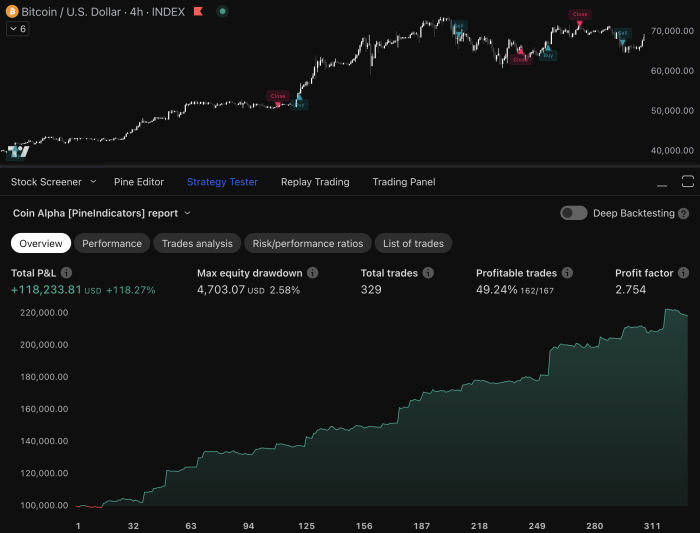
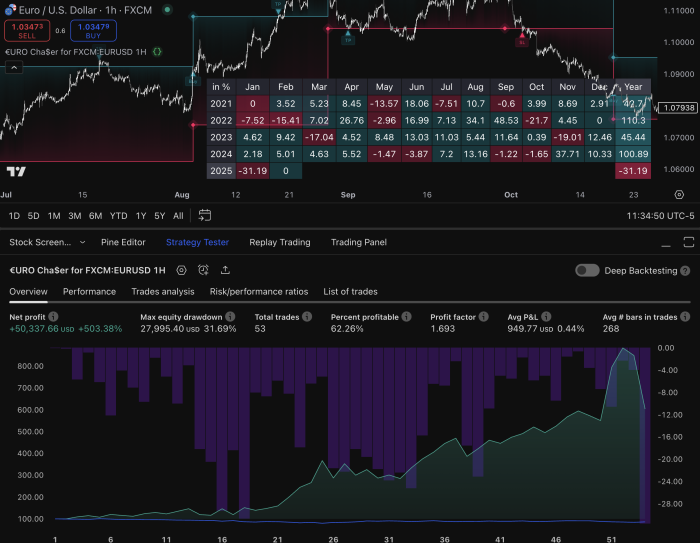
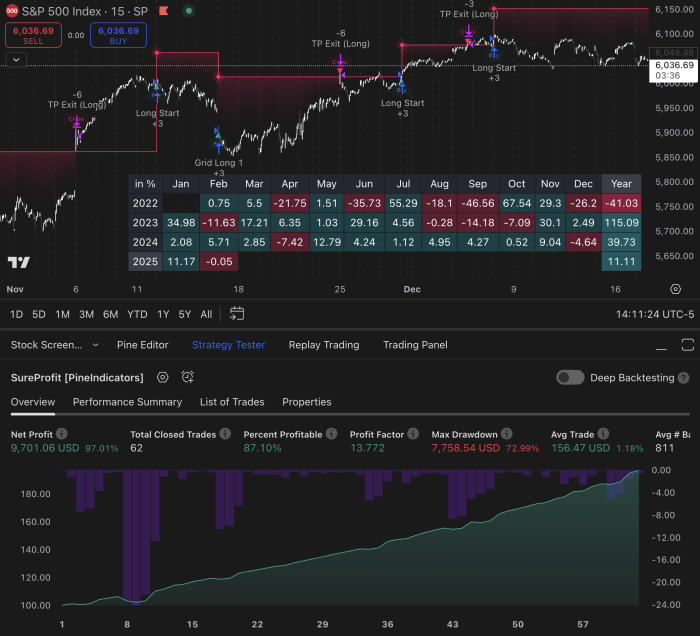
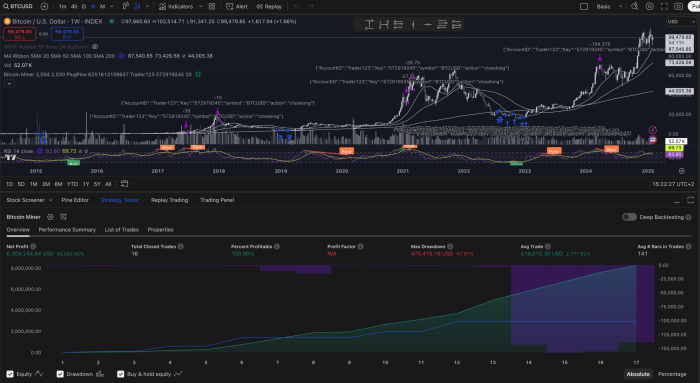
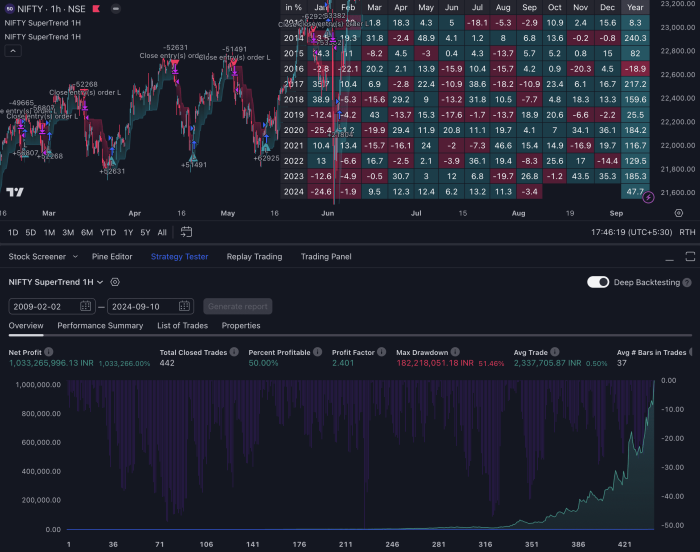
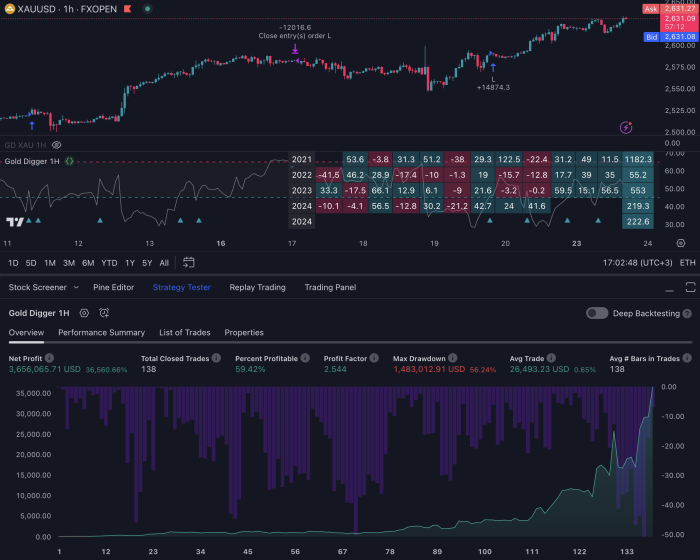
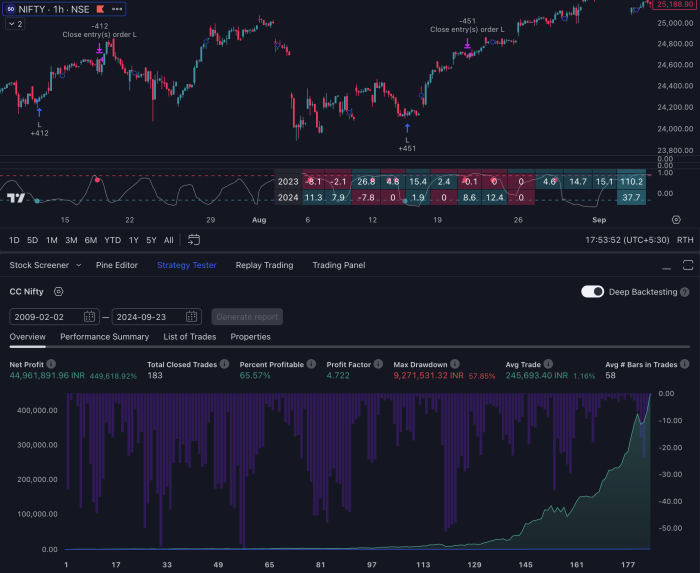
Introduction
Successful trading demands more than intuition—it requires a systematic approach backed by data-driven decisions. Backtesting stands as a cornerstone practice that empowers traders to validate their strategies before risking real capital in live markets.
Think of backtesting as your trading strategy’s proving ground. This methodical process allows you to:
- Test your trading ideas against historical market data
- Identify potential weaknesses in your approach
- Measure expected performance metrics
- Refine your strategy based on concrete results
Your journey to enhanced trading performance starts with understanding how your strategies might have performed in past market conditions. Through backtesting, you gain valuable insights into the robustness of your trading approach across different market scenarios.
PineIndicators.com provides traders with powerful tools to optimize their strategies through comprehensive backtesting capabilities. You’ll find a rich collection of high-performing indicators and custom scripts designed specifically for TradingView, enabling you to:
- Analyze strategy performance across multiple timeframes
- Access pre-built indicators with proven track records
- Customize testing parameters to match your trading style
- Generate detailed performance reports
By leveraging these resources, such as their automated Pine Script strategies, you can transform theoretical trading concepts into validated strategies ready for real-market deployment. Moreover, their advanced Pine Script tutorials equip you with the knowledge to further enhance your strategy development process. If you’re looking for specific TradingView breakout strategies, they also offer a range of options tailored to different trading styles.
Understanding Backtesting
Backtesting serves as your trading strategy’s proving ground – a systematic process that lets you evaluate how well your trading ideas would have performed in past market conditions. Think of it as a time machine that allows you to test your trading decisions against historical market data without risking real capital.
The Basics of Backtesting
At its core, backtesting involves:
- Running your trading strategy through historical price data
- Recording hypothetical trades based on your predefined rules
- Analyzing the results to assess strategy performance
Key Elements of a Successful Backtest
A robust backtesting framework consists of three essential components:
Historical Data Quality
Ensure that the historical price data you use for backtesting is:
- Clean and accurate
- Sufficiently deep to capture market movements
- Relevant to the timeframe you’re trading
Strategy Implementation
Clearly define your trading strategy by specifying:
- Entry and exit rules
- Position sizing guidelines
- Risk management parameters
Performance Measurement
Evaluate the effectiveness of your strategy using various metrics such as:
- Trade-by-trade analysis
- Risk-adjusted returns
- Drawdown assessment
Testing Across Different Market Conditions
You can backtest strategies across different market conditions to gain insights into their robustness:
- Bull markets
- Bear markets
- Sideways/ranging markets
- High volatility periods
- Low volatility environments
The depth of your backtesting analysis directly impacts the reliability of your results. A thorough backtest examines multiple aspects of strategy performance:
- Trade Execution
- Entry price accuracy
- Fill assumptions
- Slippage considerations
- Market Impact
- Volume requirements
- Liquidity constraints
- Transaction costs
- Risk Parameters
- Position sizing rules
- Stop-loss placement
- Profit target levels
Tools for Efficient Backtesting
Professional traders often use specialized platforms like PineIndicators.com to streamline their backtesting process. These tools provide advanced features for strategy development, testing, and optimization across multiple timeframes and market conditions.
For instance, traders can utilize Forex Pine Script strategies or explore scalping strategies tailored for TradingView. Additionally, Pine script templates can be employed to enhance strategy implementation while RSI strategies for TradingView offer valuable insights into performance measurement. Furthermore, there are also specific Forex indicator scripts for TradingView, which can significantly improve the quality of historical data used in backtesting.
The Backtesting Process Explained
The backtesting process consists of four critical phases that work together to validate your trading strategy’s effectiveness. Let’s dive deep into each component:
1. Strategy Formulation
Your trading strategy needs clear, quantifiable rules for market entry and exit. These rules might include:
- Price action patterns
- Technical indicator signals
- Specific market conditions
- Position sizing requirements
- Stop-loss and take-profit levels
You’ll need to translate these rules into precise, testable conditions. For example, a strategy might buy when the 50-day moving average crosses above the 200-day moving average and the RSI is below 30. You could also explore advanced strategies like the EMA crossover for more effective trading.
2. Historical Data Selection
Selecting appropriate historical data is crucial for meaningful results. Consider these factors:
- Time period length: Test across different market cycles
- Data quality: Use clean, accurate price data
- Market conditions: Include both bullish and bearish periods
- Trading hours: Account for market session times
- Asset-specific events: Consider stock splits, dividends, or delistings
3. Trade Simulation
During the simulation phase, your strategy executes trades based on your predefined rules. Key elements include:
- Position sizing: Determining trade quantities
- Slippage modeling: Accounting for price differences between signal and execution
- Commission costs: Including broker fees and spreads
- Execution delays: Simulating realistic order fill times
- Trading restrictions: Implementing any specific trading rules or limitations
You might want to use some of the best indicators for TradingView in 2024 to enhance your trade simulation phase.
4. Performance Analysis
The analysis phase examines your strategy’s behavior through various metrics:
Profitability Measures
- Net profit/loss
- Profit factor
- Average trade return
Risk Assessment
- Maximum drawdown
- Risk-adjusted returns
- Volatility measures
Trade Statistics
- Win rate
- Average winning trade
- Average losing trade
- Number of trades
These metrics help identify potential weaknesses in your strategy. For instance, a high win rate might be overshadowed by large losing trades, indicating a need to adjust your position sizing or stop-loss levels.
The backtesting process requires careful attention to detail and realistic assumptions. Each phase builds upon the previous one, creating a comprehensive evaluation framework for your trading strategy. By following this structured approach, you can identify potential issues before risking real capital in live markets.
In addition to traditional strategies, you may also want to explore advanced trading strategies specifically designed for cryptocurrency markets or consider implementing an adaptive system like the Versatile Bollinger Band Cascade, which offers unique features and customization options that can elevate your trading experience.
Key Performance Indicators (KPIs) in Backtesting Trading Strategies
Key Performance Indicators (KPIs) are crucial metrics that measure how effective your trading strategy is. These numerical benchmarks help you make informed decisions about whether your strategy is viable and potentially profitable in real market conditions.
Essential KPIs for Strategy Evaluation
Here are some important KPIs you should consider when evaluating your trading strategy:
1. Net Profit
This metric represents the raw profit or loss generated by your strategy. It takes into account transaction costs and fees, and can be measured in absolute terms or as percentage returns. Net profit helps you determine the potential profitability of your strategy.
2. Maximum Drawdown
Maximum drawdown refers to the largest decline in portfolio value from its peak to its trough. This metric indicates the worst-case scenario for potential losses and is critical for assessing risk and determining position sizes. It also helps you set realistic stop-loss levels.
3. Win Rate and Loss Rate
The win rate is the percentage of profitable trades, while the loss rate is the percentage of losing trades. Successful strategies typically maintain win rates between 40% and 60%. However, it’s important to analyze these rates alongside the average profit or loss per trade to get a complete picture of your strategy’s consistency.
4. Average Trade Metrics
Average trade metrics include the average profit per winning trade, average loss per losing trade, and average holding period. These insights provide valuable information about how efficient your trades are.
5. Risk/Reward Ratio
The risk/reward ratio measures the potential profit against the potential loss of a trade. An ideal minimum ratio is 1:1.5 or higher, meaning that for every dollar you risk, you aim to make at least $1.50 in profit. Higher ratios indicate better risk-adjusted returns and can help you optimize position sizes and manage risks effectively.
6. Sharpe Ratio
The Sharpe ratio measures the risk-adjusted returns of your strategy. Higher values indicate better risk-adjusted performance compared to a benchmark or risk-free rate. It is an industry standard for comparing different strategies and values above 1 are considered acceptable, while values above 2 are excellent.
These KPIs work together to create a comprehensive performance profile of your trading strategy. By analyzing these metrics in combination, you can identify potential weaknesses, optimize entry and exit points, and refine your position sizing rules for improved results.
Using platforms like PineIndicators.com, you can track these KPIs in real-time during your backtesting process. This allows for quick adjustments to your strategy based on concrete data rather than relying on gut feelings or assumptions.
For instance, you can explore their advanced Pine Script strategies which enhance your trading on TradingView with backtesting and risk management techniques. Additionally, they offer high-profit trading strategies that can significantly improve your trading outcomes.
Their resources on technical analysis provide valuable insights into market trends, while the best entry and exit strategies guide you in optimizing your trades for maximum profitability.
Leveraging KPIs for Strategy Refinement and Risk Management
KPI analysis serves as your compass for strategy optimization, pointing directly to areas needing adjustment in your trading approach. By examining these performance metrics, you can pinpoint specific patterns and behaviors that impact your strategy’s effectiveness.
Strategy Refinement Through KPI Analysis
- Entry Point Optimization: Track your win rate across different market conditions to identify the most profitable entry signals. You might want to explore some buy crypto strategies for TradingView that could enhance your entry point.
- Exit Strategy Enhancement: Analyze average profit per trade to determine optimal take-profit and stop-loss levels
- Position Sizing Adjustment: Use maximum drawdown data to calibrate position sizes that align with your risk tolerance
- Time-Based Performance: Study your strategy’s behavior during specific market hours or sessions to optimize trading windows
To further refine your trading strategies, consider utilizing the TradingView strategy tester. This tool can provide valuable insights into the performance of your strategies under various market conditions.
Risk Management Enhancement
Your KPIs provide crucial insights for building robust risk management protocols:
- Set realistic stop-loss levels based on historical volatility patterns
- Adjust position sizes according to drawdown tolerance
- Implement dynamic risk parameters that adapt to market conditions
- Create correlation-based portfolio allocation rules
Building Trading Confidence
KPI-driven strategy refinement strengthens your trading psychology:
- Data-backed decisions reduce emotional trading
- Clear performance metrics help maintain discipline during drawdowns
- Systematic approach builds confidence in your strategy
- Historical performance data supports steady execution during market stress
Advanced Strategy Optimization
You can leverage KPIs for sophisticated strategy enhancements:
- Cross-reference multiple KPIs to identify optimal trading conditions
- Create custom performance metrics specific to your trading style
- Develop adaptive parameters that respond to changing market conditions
- Build correlation matrices to identify strategy weaknesses
By continuously monitoring and adjusting your strategy based on KPI analysis, you create a dynamic trading system that evolves with market conditions while maintaining consistent risk management practices.
For those looking to delve deeper into the technical aspects of implementing these strategies, learning Pine Script could be beneficial. This programming language used in TradingView can help you customize your strategies further and adapt them to your unique trading style. If you’re not familiar with Pine Script, consider seeking assistance from Pine Script experts who can guide you through the process.
Benefits of Backtesting Trading Strategies
Backtesting gives traders data-driven insights through quantitative evaluations of their trading strategies. Here are the key advantages that make backtesting an essential tool:
1. Risk-Free Strategy Testing
- Test your trading ideas without risking real capital
- Experiment with different parameters and market conditions
- Identify potential weaknesses before live implementation
2. Performance Optimization
- Fine-tune entry and exit points based on historical data
- Adjust position sizing for optimal risk management
- Identify the most profitable market conditions for your strategy
3. Scenario Testing Capabilities
- Evaluate strategy performance during market crashes
- Test resilience during high volatility periods
- Assess behavior across different market cycles
4. Psychological Benefits
- Build confidence in your trading approach
- Develop discipline through systematic testing
- Reduce emotional decision-making in live trading
5. Cost-Effective Development
- Identify strategy flaws before deployment
- Save time by automating multiple tests
- Reduce potential losses from untested strategies
Backtesting on platforms like PineIndicators.com allows you to leverage these benefits through automated tools and comprehensive testing environments. You can rapidly iterate through different strategy variations and market conditions to build robust trading systems backed by historical performance data.
Challenges and Limitations to Consider in Backtesting
Backtesting presents several critical challenges that can impact the reliability of your trading strategy evaluation:
1. Data Quality and Availability
- Historical data may contain gaps, errors, or biases
- Limited access to tick-by-tick data for accurate price movements
- Lack of volume data for certain markets or time periods
2. Market Conditions and Assumptions
- Past performance doesn’t guarantee future results
- Market dynamics change over time
- Difficulty in simulating real-world trading conditions
3. Technical Limitations
- Slippage effects might be underestimated
- Transaction costs and fees can be complex to model
- Time gaps between signal generation and execution
4. Overfitting Risk
- Strategies may be optimized too specifically to historical data
- Curve-fitting can create unrealistic performance expectations
- Complex strategies might fail in live trading conditions
5. Psychological Factors
- Backtesting can’t replicate emotional decision-making
- Paper trading differs from real money scenarios
- Strategy adherence varies in live market conditions
These challenges highlight the importance of implementing robust validation methods and maintaining realistic expectations when developing your trading strategies. A comprehensive approach to backtesting acknowledges these limitations while seeking ways to minimize their impact on strategy performance.
Enhancing Portfolio Diversification through Effective Backtesting
Backtesting empowers you to build a robust, diversified portfolio by testing multiple strategies across different market conditions and asset classes. This systematic approach helps you identify strategies that work well together, reducing your portfolio’s overall risk exposure.
Here’s how backtesting strengthens your portfolio diversification:
- Cross-Market Analysis: Test your strategies across stocks, cryptocurrencies, forex, and commodities to find opportunities in different market segments
- Correlation Assessment: Identify strategies that perform independently of each other, helping you maintain stability when specific markets face turbulence
- Time-Frame Optimization: Evaluate strategy performance across different timeframes to create a balanced mix of short-term and long-term trades
- Risk Distribution: Assess position sizing and risk allocation across multiple strategies to maintain optimal portfolio balance
By running parallel backtests on different strategies, you can:
- Measure strategy performance during various market cycles
- Identify complementary strategies that offset each other’s drawdowns
- Optimize capital allocation between different trading approaches
- Test portfolio rebalancing frequencies and methods
Using platforms like PineIndicators.com, you can access pre-built indicators and strategies to expand your testing capabilities across multiple markets. This data-driven approach helps you build a diversified portfolio based on proven historical performance rather than assumptions or gut feelings.
Conclusion
Backtesting is a crucial part of successful trading. It turns theoretical strategies into decisions based on data. To become a skilled trader, you need this practical foundation. It’s not enough to just have strategies; you must also know they work through thorough testing and validation.
The road to becoming a successful market participant begins with adopting these evidence-based approaches. Each backtest you conduct adds another layer of understanding to your trading skills, enabling you to develop strong strategies that can endure different market situations.
Ready to take your trading skills to the next level? PineIndicators.com has everything you need:
- High-performing indicators designed for TradingView
- Advanced backtesting tools to optimize your strategies
- Professional-grade resources for strategy refinement
- A community of dedicated traders sharing insights
With custom indicator scripts tailored specifically for TradingView, you can master trading and enhance your strategies. Furthermore, our platform offers access to the best TradingView strategies that have proven successful in various market conditions.
Take the next step in your trading journey – visit PineIndicators.com and transform your trading strategies with powerful backtesting capabilities and access to top Pine Script strategies that will enhance your trading with custom indicators and effective techniques. Your path to data-driven trading success begins here.
FAQs (Frequently Asked Questions)
What is backtesting and why is it significant for trading strategies?
Backtesting is the process of evaluating the effectiveness of trading strategies by simulating trades using historical market data. It is significant because it allows traders to assess how a strategy would have performed in the past, helping them to refine their approach before applying it in live markets.
What steps are involved in the backtesting process?
The backtesting process involves several key steps: Strategy formulation, where traders develop their trading strategy based on market analysis; Historical data selection, which involves choosing relevant past market data; Simulation of trades, where the strategy is executed on historical data; and Performance analysis, where key metrics like net profit and maximum drawdown are evaluated.
What are some important Key Performance Indicators (KPIs) to consider during backtesting?
Important KPIs to consider include Net Profit, which indicates total profit generated after costs; Maximum Drawdown, which shows the largest decline from peak to trough; Average Win/Loss/Return per Trade, which helps gauge consistency; and Reward/Risk Ratio, which compares potential rewards against risks taken.
How can KPIs aid in refining trading strategies?
Analyzing KPIs can help identify strengths and weaknesses in trading strategies. This information is crucial for optimizing profitability and enhancing risk management practices, ultimately building trader confidence in their strategies.
What are some challenges associated with backtesting?
Common challenges in backtesting include risks of overfitting, where a strategy may perform well on historical data but fails in live markets; flawed assumptions that may not hold true under different market conditions; and ensuring that the historical data used reflects realistic trading scenarios.
How does effective backtesting contribute to portfolio diversification?
Robust backtesting practices allow traders to evaluate multiple strategies across different markets or asset classes. This evaluation helps in identifying diverse opportunities and risks, contributing to broader portfolio diversification and potentially enhancing overall investment performance.

